Istio Service Mesh
What is Service Mesh?
A service mesh is an infrastructure layer that manages how services communicate with each other. It makes communication manageable, visible, and controlled.
The Problem It Solves
Old Way (Without Service Mesh)
- Each service has its own communication logic (retries, timeouts, routing)
- Developers write this logic inside each service
- Problems:
- Hard to manage when you have many services
- If using different languages, need to rewrite same logic
- Can't update third-party services easily
- Configuration becomes messy
Service Mesh Way
- Extracts communication logic from services
- Puts it in a separate layer using network proxies
- Proxies handle all communication
- Control plane manages all proxies
Deployment Models
Deployment Model Comparison
| Model | Architecture | Pros | Cons | Istio Support |
|---|---|---|---|---|
| Sidecar | Proxy per pod | Strong isolation | Higher resource usage | ✅ Production-ready |
| Ambient | Node-level proxy (L4) + optional waypoint (L7) | Lower resource usage | Less isolation | ✅ Production-ready |
| Cilium Mesh | eBPF kernel-level (L4) + L7 when needed | Very efficient, secure | More complex | ❌ Not supported |
| gRPC | Proxy built into app | Fastest (no extra hop) | Requires code changes | ❌ Not supported |
1. Sidecar Model
- Each service gets its own proxy container
- Pros: Strong isolation between services
- Cons: Uses more resources (CPU, memory)
2. Ambient Mode
- ztunnel: Lightweight proxy per node for L4 traffic
- waypoint proxy: Optional L7 proxy at namespace or service level
- Pros: Lower resource consumption
- Cons: Less isolation than sidecar
3. Cilium Mesh Mode
- Uses eBPF (kernel-level networking) for L4 traffic
- Adds L7 proxy only when needed
- Pros: Very efficient and secure
- Cons: More complex setup
4. gRPC Mode
- Proxy built directly into the application
- Pros: Fastest performance (no extra network hop)
- Cons: Requires application code changes
Istio supports Sidecar and Ambient modes. Both are production-ready.
Why Use Service Mesh?
Security
- Automatic mTLS encryption between services
- Auto certificate rotation without manual intervention
- Zero-trust networking by default
Observability
- See all traffic, failures, and retries
- Detailed metrics for debugging
- Real-time monitoring of service health
Traffic Management
- Weighted routing (e.g., 90% old version, 10% new)
- Canary deployments for safe rollouts
- A/B testing capabilities
- Blue-green deployments
Resilience
- Automatic retries for failed requests
- Timeouts to prevent hanging requests
- Circuit breakers to stop calling broken services
- Rate limiting to prevent overload
Debugging
- Distributed tracing (Jaeger, Zipkin)
- See complete request path across services
- Identify bottlenecks and latency issues
Testing
- Fault injection for chaos engineering
- Test how system handles failures
- Simulate network delays and errors
Service mesh lets infrastructure handle communication, so developers can focus on business logic.
Introducing Istio
What is Istio?
Istio is an open-source service mesh implementation that provides three core capabilities:
1. Traffic Management
- Control traffic flow between services using configuration files
- Set circuit breakers, timeouts, retries with simple config
- No code changes needed
2. Observability
- Tracing, monitoring, and logging built-in
- See what's happening in your services
- Find and fix issues quickly
3. Security
- Authentication, authorization, and encryption at proxy level
- Change policies with configuration (no code changes)
- Enforce rules across all services
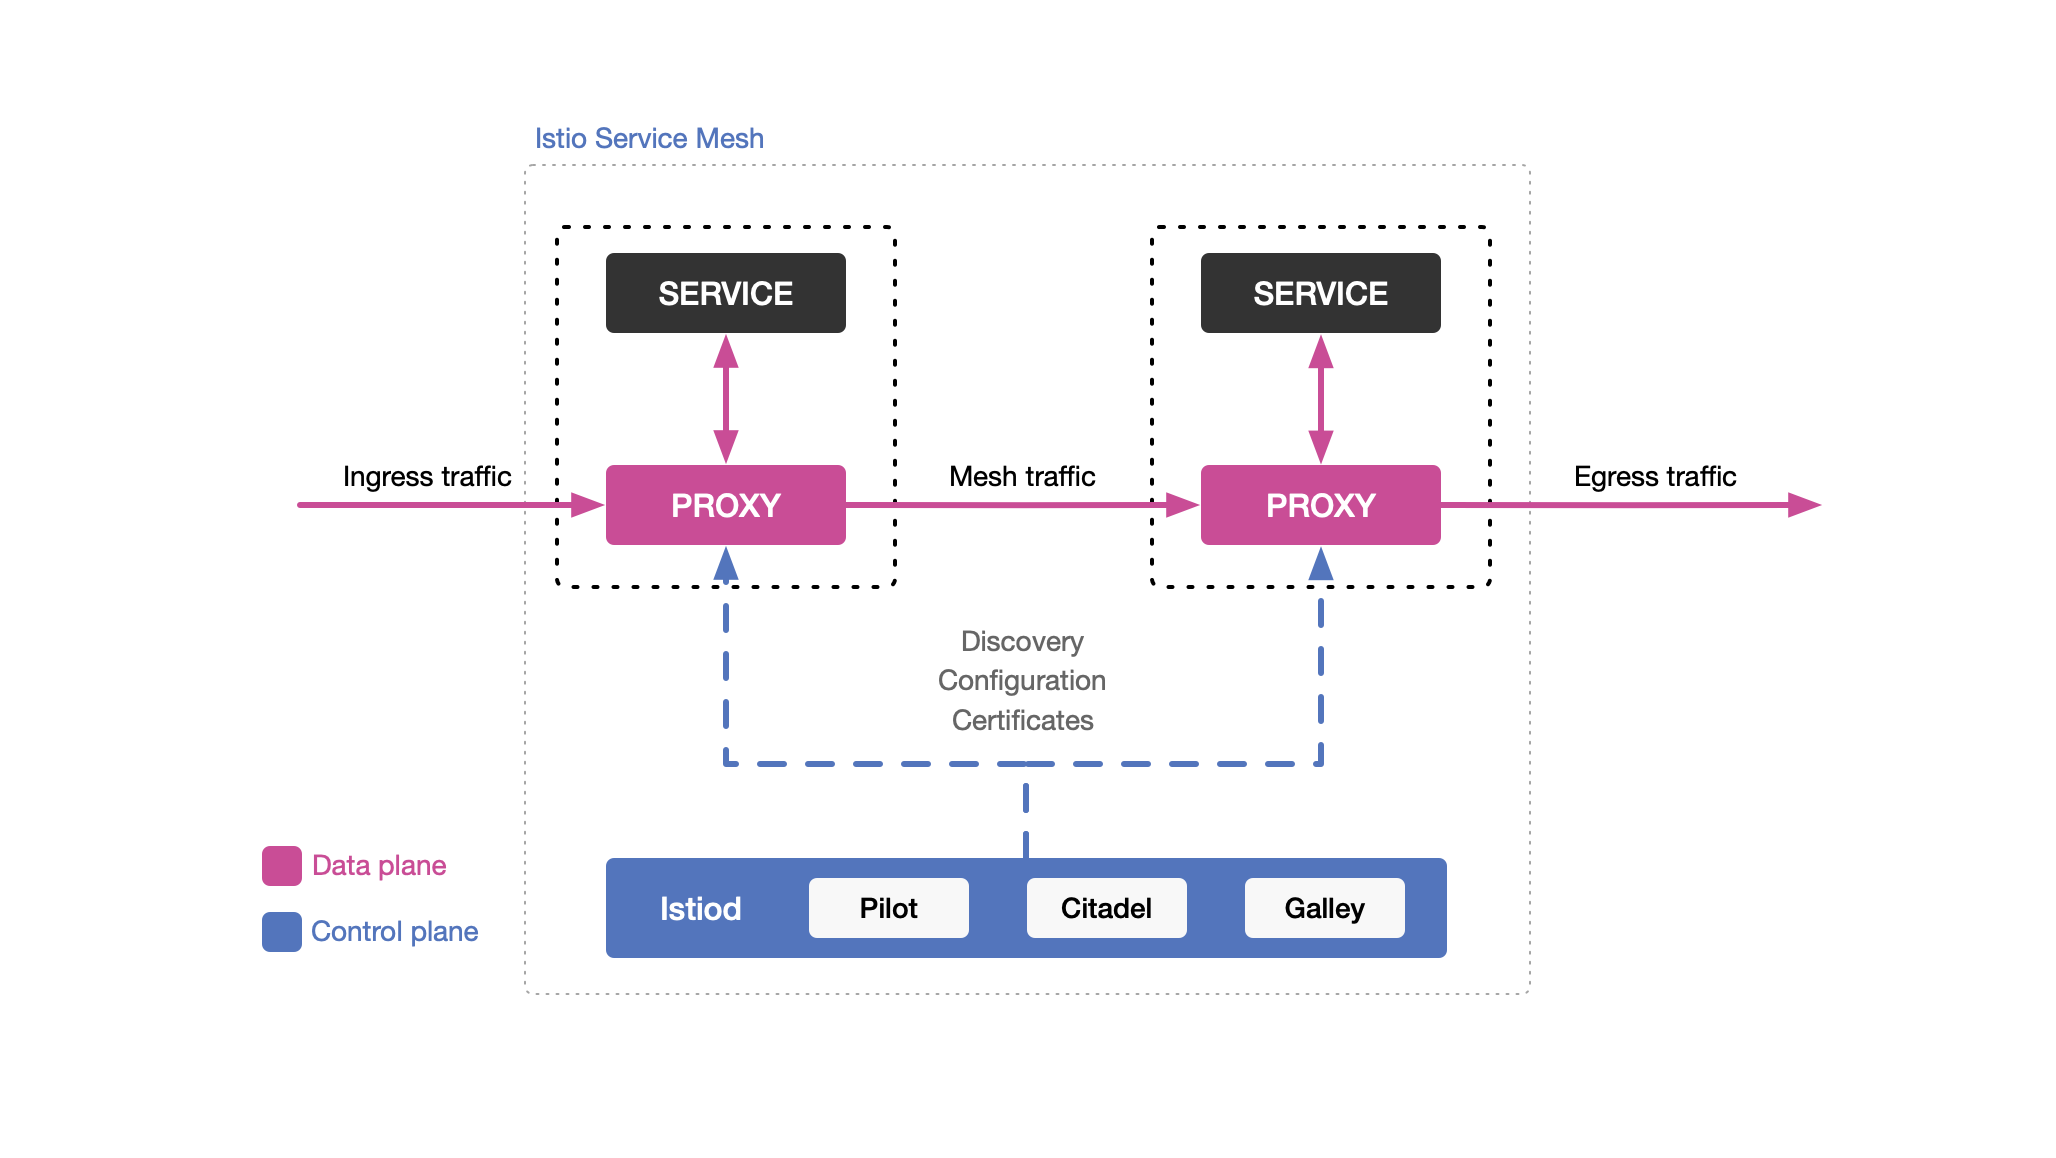
Istio Architecture
Istio consists of two main components:
| Component | Function | On Request Path | Technology |
|---|---|---|---|
| Data Plane | Handles actual traffic | ✅ Yes | Envoy proxies |
| Control Plane | Manages and configures data plane | ❌ No | Istiod |
Data Plane
- Handles actual traffic between services
- On the request path (affects latency)
- Uses Envoy proxies
Control Plane
- Manages and configures data plane
- Not on request path (no latency impact)
- Uses Istiod (single binary)
Data Plane: Two Modes
Sidecar Mode
- Envoy proxy runs next to each app container
- Intercepts all traffic in and out
- Can be automatic (webhook) or manual injection
- All proxies together form the data plane
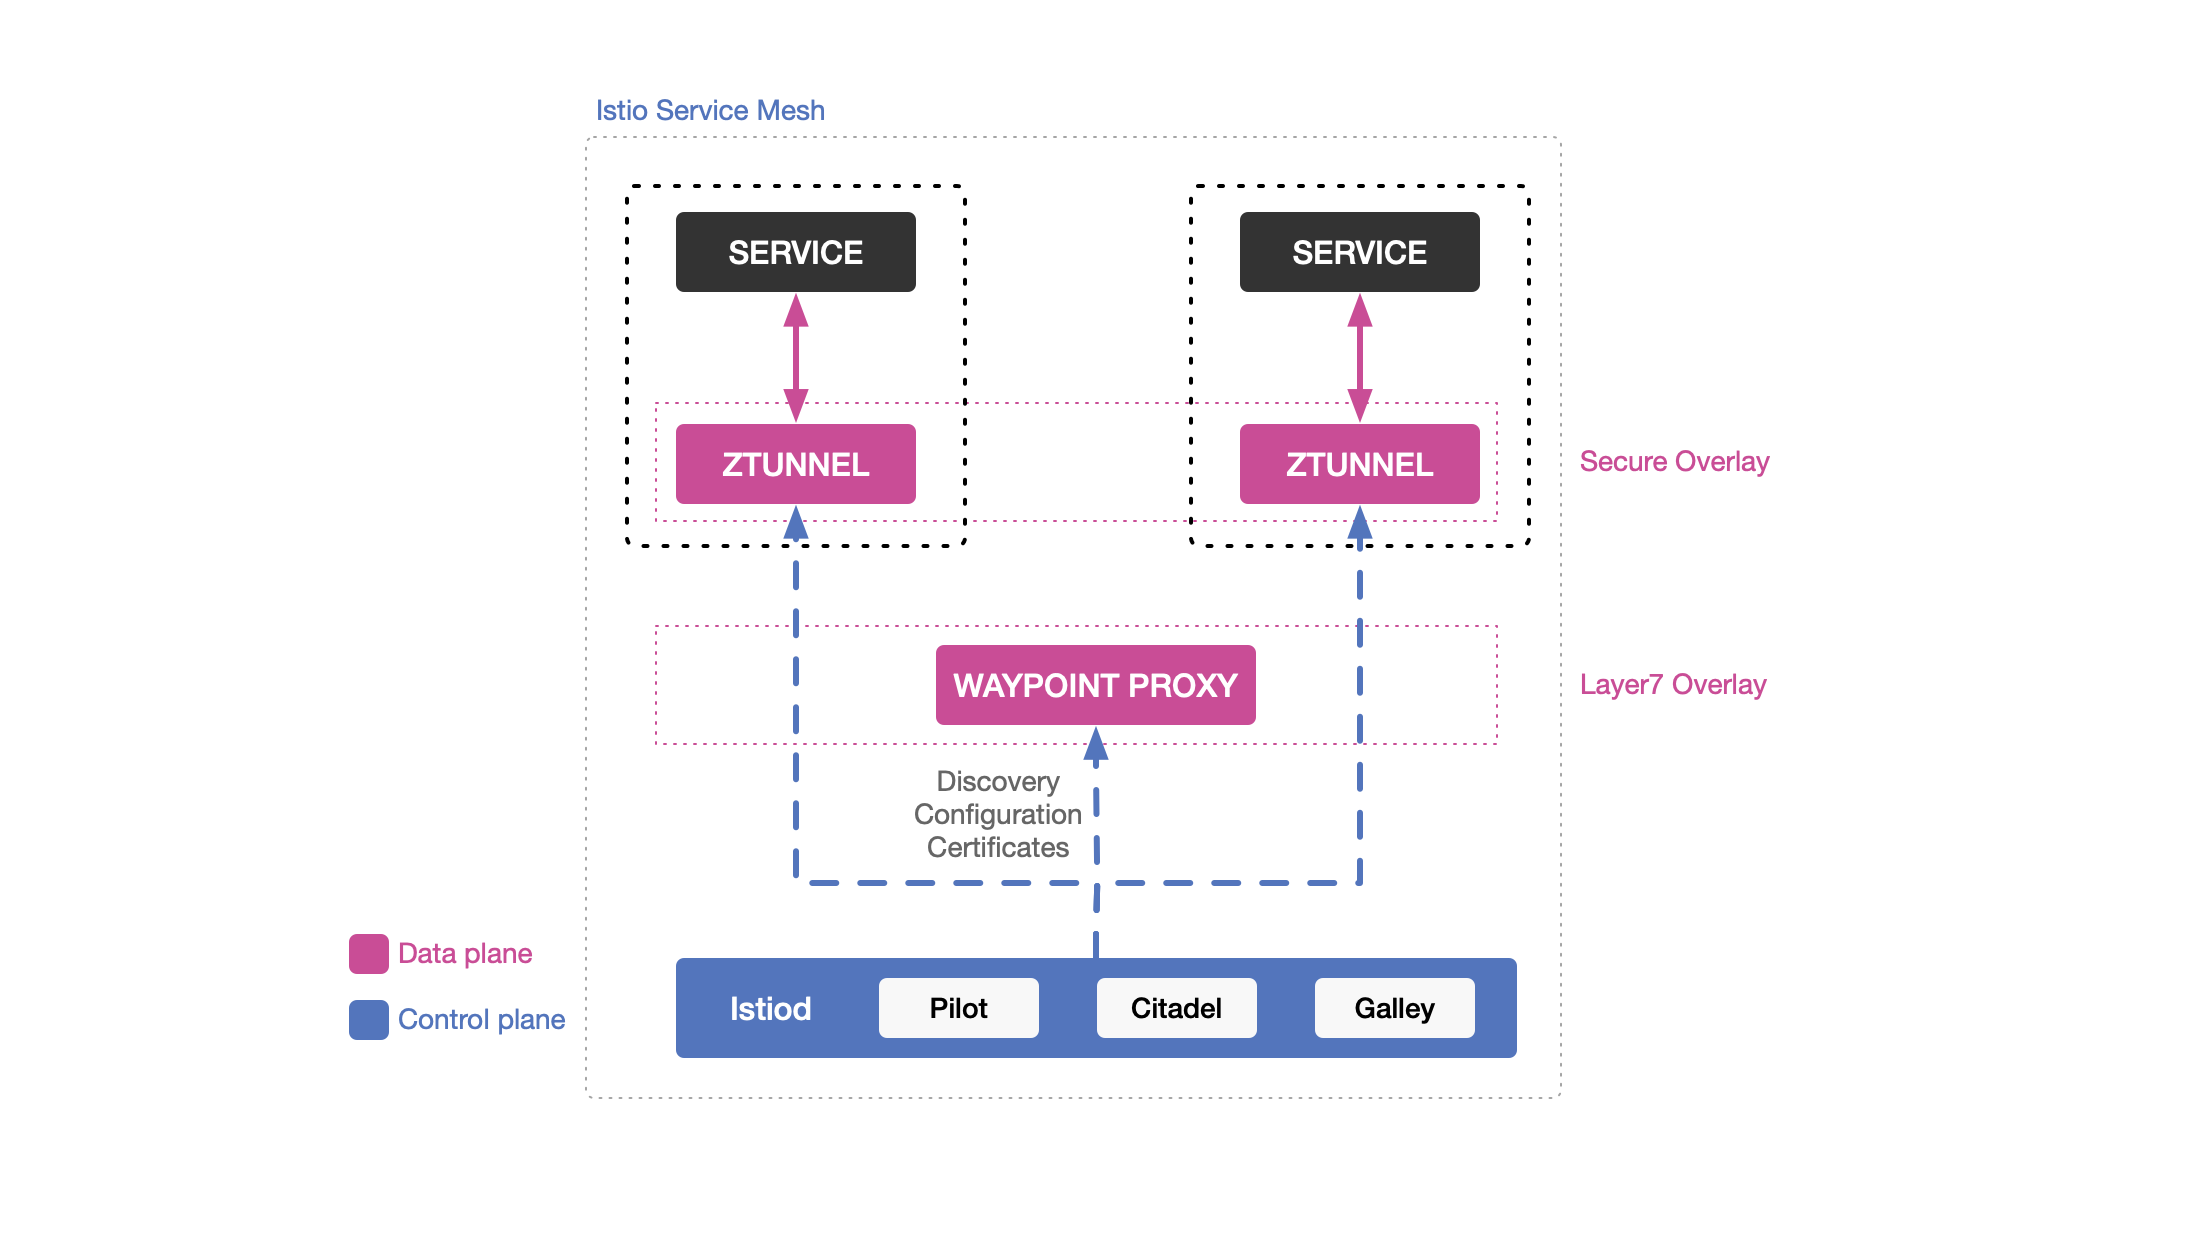
Ambient Mode (Production-Ready)
- No sidecar needed
- ztunnel: L4 proxy per node (basic traffic)
- waypoint proxy: L7 proxy when needed (advanced traffic)
- Uses fewer resources
- Now production-ready (GA)
| Feature | Sidecar Mode | Ambient Mode |
|---|---|---|
| Proxy Location | Per pod | Per node (ztunnel) |
| Resource Usage | Higher | Lower |
| L4 Traffic | Sidecar | ztunnel |
| L7 Traffic | Sidecar | waypoint proxy |
| Injection Required | ✅ Yes | ❌ No |
Key Components
Envoy (Data Plane)
High-performance proxy written in C++
Capabilities:
- Load balancing
- Circuit breaking
- Fault injection
- Traffic routing
- Observability metrics
WebAssembly Support: Extend functionality with custom Wasm plugins
Deployment:
- Sidecar mode: Runs as sidecar container
- Ambient mode: Runs as waypoint proxy
Istiod (Control Plane)
Istiod performs four main functions:
1. Service Discovery
- Finds all services (Kubernetes or VMs)
- Converts to standard format
- Maintains service registry
2. Configuration Management
- Takes your YAML rules
- Converts to Envoy configuration
- Distributes config to all proxies
3. Certificate Management
- Acts as certificate authority (CA)
- Generates and rotates certificates automatically
- Enables mTLS between proxies
4. Security
- Service-to-service authentication
- End-user authentication
- Authorization policies (who can access what)
How Istio Works
1. Write YAML configuration
   ↓
2. Istiod reads configuration
   ↓
3. Converts to Envoy/ztunnel config
   ↓
4. Distributes to all proxies
   ↓
5. Proxies handle traffic based on config
Istio = Control plane (Istiod) + Data plane (Envoy proxies)
- Sidecar mode: Proxy per container
- Ambient mode: Shared proxies (lower overhead)
Installing Istio - Components & Profiles
Gateway Components
Ingress Gateway
- Handles traffic coming INTO the mesh
- Envoy proxy for inbound traffic
- Supports HTTP/TCP routing
- Works with Kubernetes Gateway API
- Installed by default in
defaultprofile
Egress Gateway
- Handles traffic going OUT of the mesh
- Optional (not installed by default)
- Must be deployed manually if needed
- Useful for controlling outbound traffic
Configuration Profiles
Pre-configured setups for different use cases:
1. default (Production)
- Use for: Production environments
- Installs: istiod + Ingress Gateway
- Best for: Real deployments
2. minimal
- Use for: Custom setups
- Installs: Only istiod (no gateways)
- Best for: When you manage gateways separately
3. demo
- Use for: Learning and testing
- Installs: istiod + Ingress + Egress Gateway
Includes extra tracing/telemetry. Do not use for performance tests or production.
4. empty
- Use for: Full customization
- Installs: Nothing
- Best for: When you want total control
5. preview
- Use for: Testing new features
- Installs: Experimental features
- Best for: Early adopters
6. remote
- Use for: Multi-cluster setup
- Installs: Remote cluster components
- Best for: Connecting to central control plane
7. ambient
- Use for: Ambient mesh deployments
- Installs: istiod + ztunnel + CNI
Need extra configuration for waypoint proxies to enable L7 features.
Profile Comparison Table
| Profile | istiod | Ingress | Egress | ztunnel | Use Case |
|---|---|---|---|---|---|
| default | ✅ | ✅ | ❌ | ❌ | Production |
| minimal | ✅ | ❌ | ❌ | ❌ | Custom setup |
| demo | ✅ | ✅ | ✅ | ❌ | Learning |
| empty | ❌ | ❌ | ❌ | ❌ | Full custom |
| preview | ✅ | ✅ | ❌ | ❌ | Experimental |
| remote | ❌ | ❌ | ❌ | ❌ | Multi-cluster |
| ambient | ✅ | ❌ | ❌ | ✅ | Ambient mode |
- Production: Use
defaultprofile - Learning: Use
demoprofile - Ambient mode: Use
ambientprofile - Components can be installed together or separately based on needs
Installing Istio with Helm
What is Helm?
Helm is a package manager for Kubernetes that makes installing applications easier and repeatable.
Why Use Helm for Istio?
- Customization: Control exactly what you install
- Repeatability: Same setup every time
- Production Ready: Easy to upgrade later
- Version Control: Track changes to your configuration
Installation Steps (Sidecar Mode)
1. Add Istio Helm Repository
helm repo add istio https://istio-release.storage.googleapis.com/charts
helm repo update
2. Create Namespace
kubectl create namespace istio-system
3. Install Base Chart
helm install istio-base istio/base -n istio-system
This installs CRDs (Custom Resource Definitions) - tells Kubernetes about Istio resources.
4. Install Istiod (Control Plane)
helm install istiod istio/istiod -n istio-system --set profile=demo
Profile Options:
default: For productiondemo: For learning/testing (includes extra monitoring)
5. Enable Auto-Injection
kubectl label namespace default istio-injection=enabled
All new pods in default namespace will automatically get sidecar injected.
6. Install Ingress Gateway (Optional)
helm install istio-ingressgateway istio/gateway -n istio-system
Only needed if you want to expose services outside the cluster.
7. Verify Installation
kubectl get pods -n istio-system
Check that istiod and istio-ingressgateway (if installed) are Running.
Uninstall Istio
helm uninstall istio-ingressgateway -n istio-system
helm uninstall istiod -n istio-system
helm uninstall istio-base -n istio-system
kubectl delete namespace istio-system
Installing Istio with istioctl
What is istioctl?
istioctl is the command-line tool to install and manage Istio. This is the community-recommended installation method.
Two Installation Modes
| Mode | Description | Proxy Location |
|---|---|---|
| Sidecar | Each pod gets Envoy proxy injected | Per pod |
| Ambient | No sidecars, uses node-level proxies | Per node |
Installing Sidecar Mode
Installation Steps
# 1. Install Istio (demo profile for learning)
istioctl install --set profile=demo --skip-confirmation

# 2. Enable auto-injection
kubectl label namespace default istio-injection=enabled

# 3. Verify installation
kubectl get pods -n istio-system
You should see istiod and istio-ingressgateway Running.
Use default profile for production, not demo.
Installing Ambient Mode
What's Different?
- No sidecar per pod
- ztunnel: L4 proxy (one per node)
- waypoint proxy: L7 proxy (optional, when needed)
Platform Prerequisites
| Platform | Requirements | Notes |
|---|---|---|
| GKE | ResourceQuota for istio-system | Required |
| AKS | Network policies enabled | Works out of box |
| EKS | Calico CNI recommended | Works |
| Minikube/Kind | Check CNI compatibility | May need configuration |
Installation Steps
# 1. Install Gateway API CRDs
kubectl get crd gateways.gateway.networking.k8s.io &> /dev/null || \
  { kubectl apply -f https://github.com/kubernetes-sigs/gateway-api/releases/download/v1.2.1/standard-install.yaml; }

# 2. Install Istio (ambient profile)
istioctl install --set profile=ambient --skip-confirmation

# 3. Enable ambient mode for namespace
kubectl label namespace default istio.io/dataplane-mode=ambient

# 4. Deploy waypoint proxy (optional, for L7 features)
istioctl waypoint apply -n default --service-account default

# Or for entire namespace
istioctl waypoint apply -n default --enroll-namespace

# 5. Verify waypoint
kubectl get waypoint -n default

# 6. Verify installation
kubectl get pods -n istio-system
You should see istiod and ztunnel Running.
Canary Upgrades (Production)
What is Canary Upgrade?
Install a new Istio version alongside the old one and migrate workloads gradually.
Using Revisions
# 1. Install new version with revision tag
istioctl install --set revision=1-24-3 --set profile=default --skip-confirmation

# 2. Label namespace to use new revision
kubectl label namespace default istio.io/rev=1-24-3 --overwrite

# 3. Restart pods to pick up new version
kubectl rollout restart deployment -n default
Using Revision Tags (Recommended)
# 1. Create tag for revision
istioctl tag set prod-stable --revision=1-24-3

# 2. Label namespace with tag
kubectl label namespace default istio.io/rev=prod-stable --overwrite
- Test new version in specific namespaces
- Easy rollback if problems occur
- Gradual migration path
- Better version management
Remove Old Version
istioctl uninstall --revision=<old-revision>
Sidecar vs Ambient Mode Comparison
| Feature | Sidecar Mode | Ambient Mode |
|---|---|---|
| Proxy per pod | ✅ Yes | ❌ No |
| Resource usage | Higher | Lower |
| L4 traffic | Sidecar | ztunnel |
| L7 traffic | Sidecar | waypoint proxy |
| Injection needed | ✅ Yes | ❌ No |
| Label | istio-injection=enabled | istio.io/dataplane-mode=ambient |
- istioctl = Main tool to install Istio
- Sidecar = Traditional approach (proxy per pod)
- Ambient = Modern approach (shared proxies, lower overhead)
- Revisions = Safe way to upgrade in production
Lab 1: Installing Istio Sidecar Mode
Prerequisites
Kubernetes Cluster Options
| Option | Type | Recommended For |
|---|---|---|
| Minikube | Local | Learning, testing |
| Docker Desktop | Local | Mac/Windows users |
| kind | Local | CI/CD pipelines |
| MicroK8s | Local | Ubuntu users |
| Cloud Provider | Remote | Production-like testing |
Minimum Requirements
- RAM: 8GB
- CPUs: 4
- Kubernetes: v1.28.0 or higher
Required Tools
kubectl(Kubernetes CLI)istioctl(Istio CLI)
Minikube Setup
minikube start --driver=docker --cpus=4 --memory=8192 --disk-size=40g

minikube addons enable ingress

minikube status
Installation Steps
1. Download Istio
curl -L https://istio.io/downloadIstio | ISTIO_VERSION=1.24.3 sh -
cd istio-1.24.3
export PATH=$PWD/bin:$PATH
mv $PWD/bin/istioctl /usr/local/bin/
2. Verify istioctl
istioctl version
Should show: 1.24.3
3. Install Istio
istioctl install --set profile=demo --skip-confirmation
Profile Options:
demo: For learning (includes ingress + egress gateway)default: For production
4. Check Installation
kubectl get pods -n istio-system
You should see:
istiod- Runningistio-ingressgateway- Runningistio-egressgateway- Running
5. Enable Sidecar Auto-Injection
kubectl label namespace default istio-injection=enabled
All new pods in default namespace will automatically get sidecar injected.
6. Verify Label
kubectl get namespace -L istio-injection
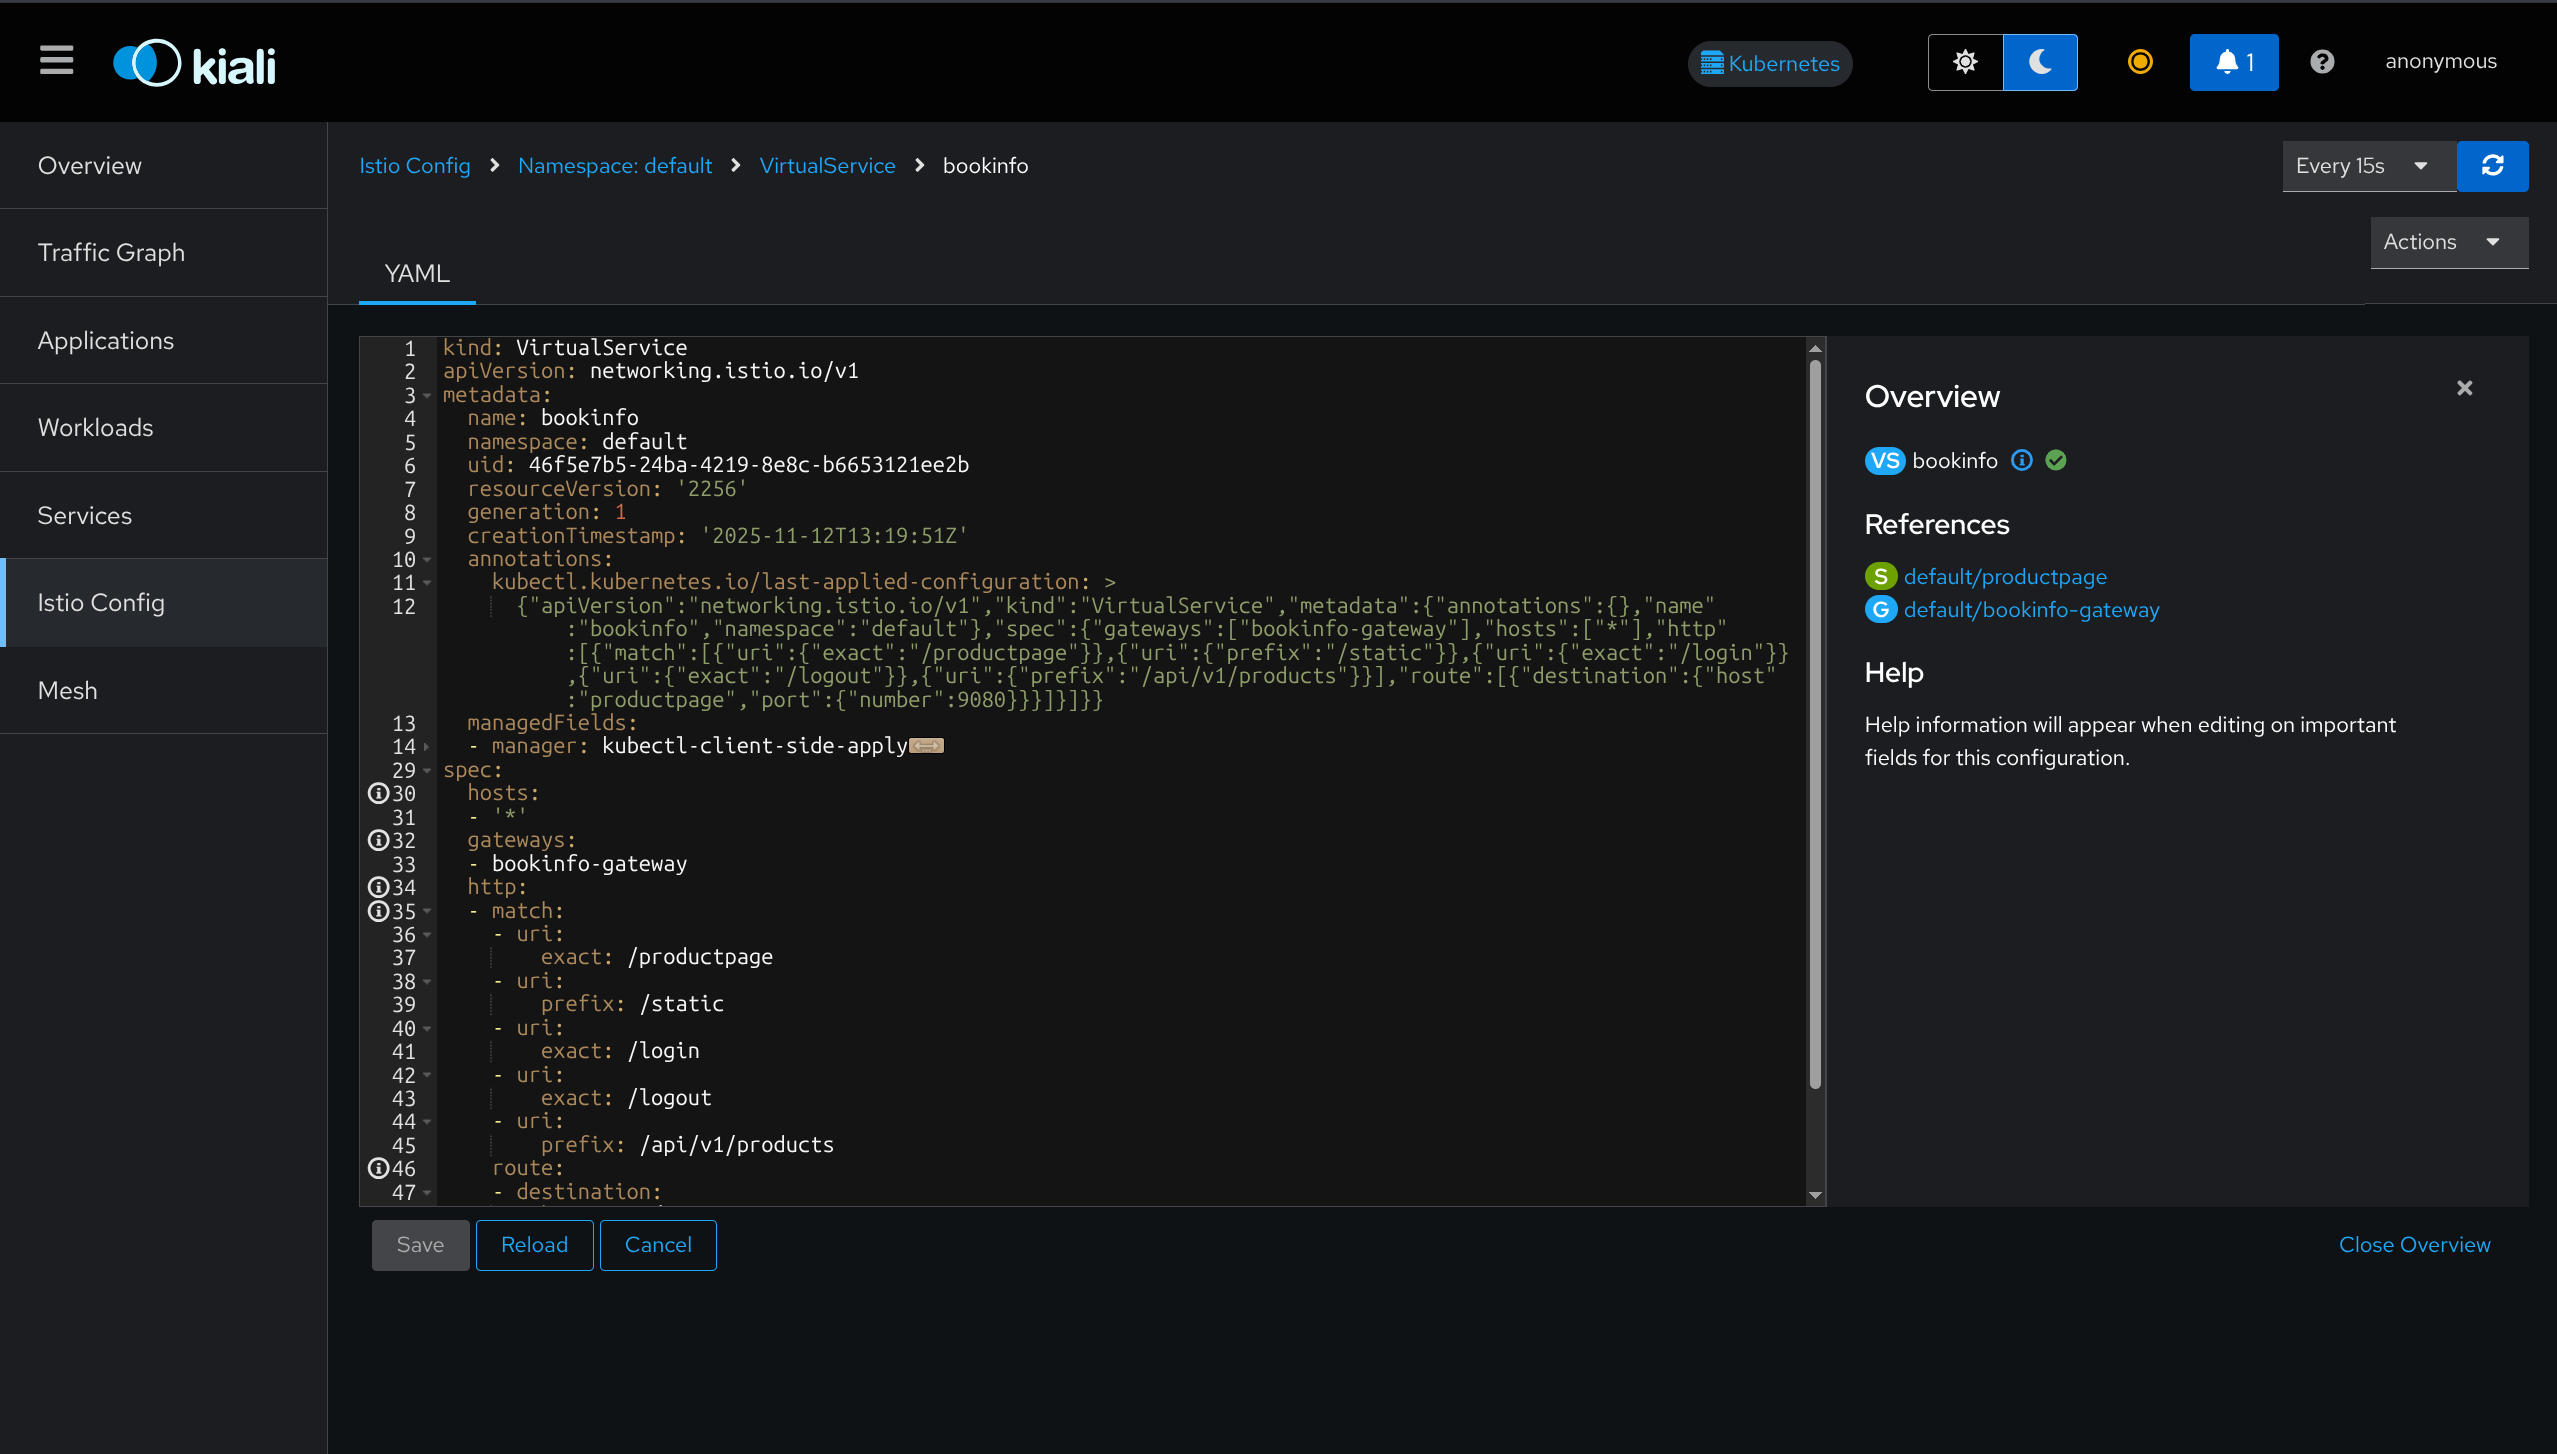
Testing with Bookinfo App
Deploy Sample App
kubectl apply -f https://raw.githubusercontent.com/istio/istio/release-1.24/samples/bookinfo/platform/kube/bookinfo.yaml
Check Pods
kubectl get pods
Each pod should show 2/2 READY (app + sidecar)
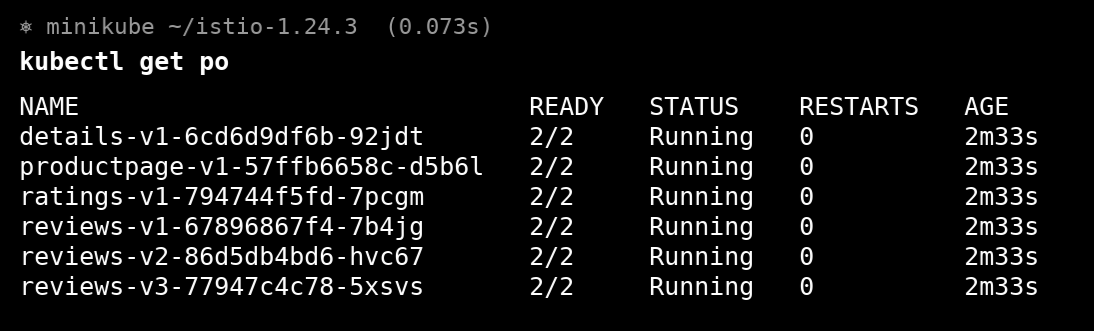
Example Output:
NAME                          READY   STATUS
productpage-v1-xxx            2/2     Running
reviews-v1-xxx                2/2     Running
Setup Ingress Gateway
kubectl apply -f samples/bookinfo/networking/bookinfo-gateway.yaml
Access Application (Minikube)
minikube tunnel
Then open browser: http://externalIP/productpage
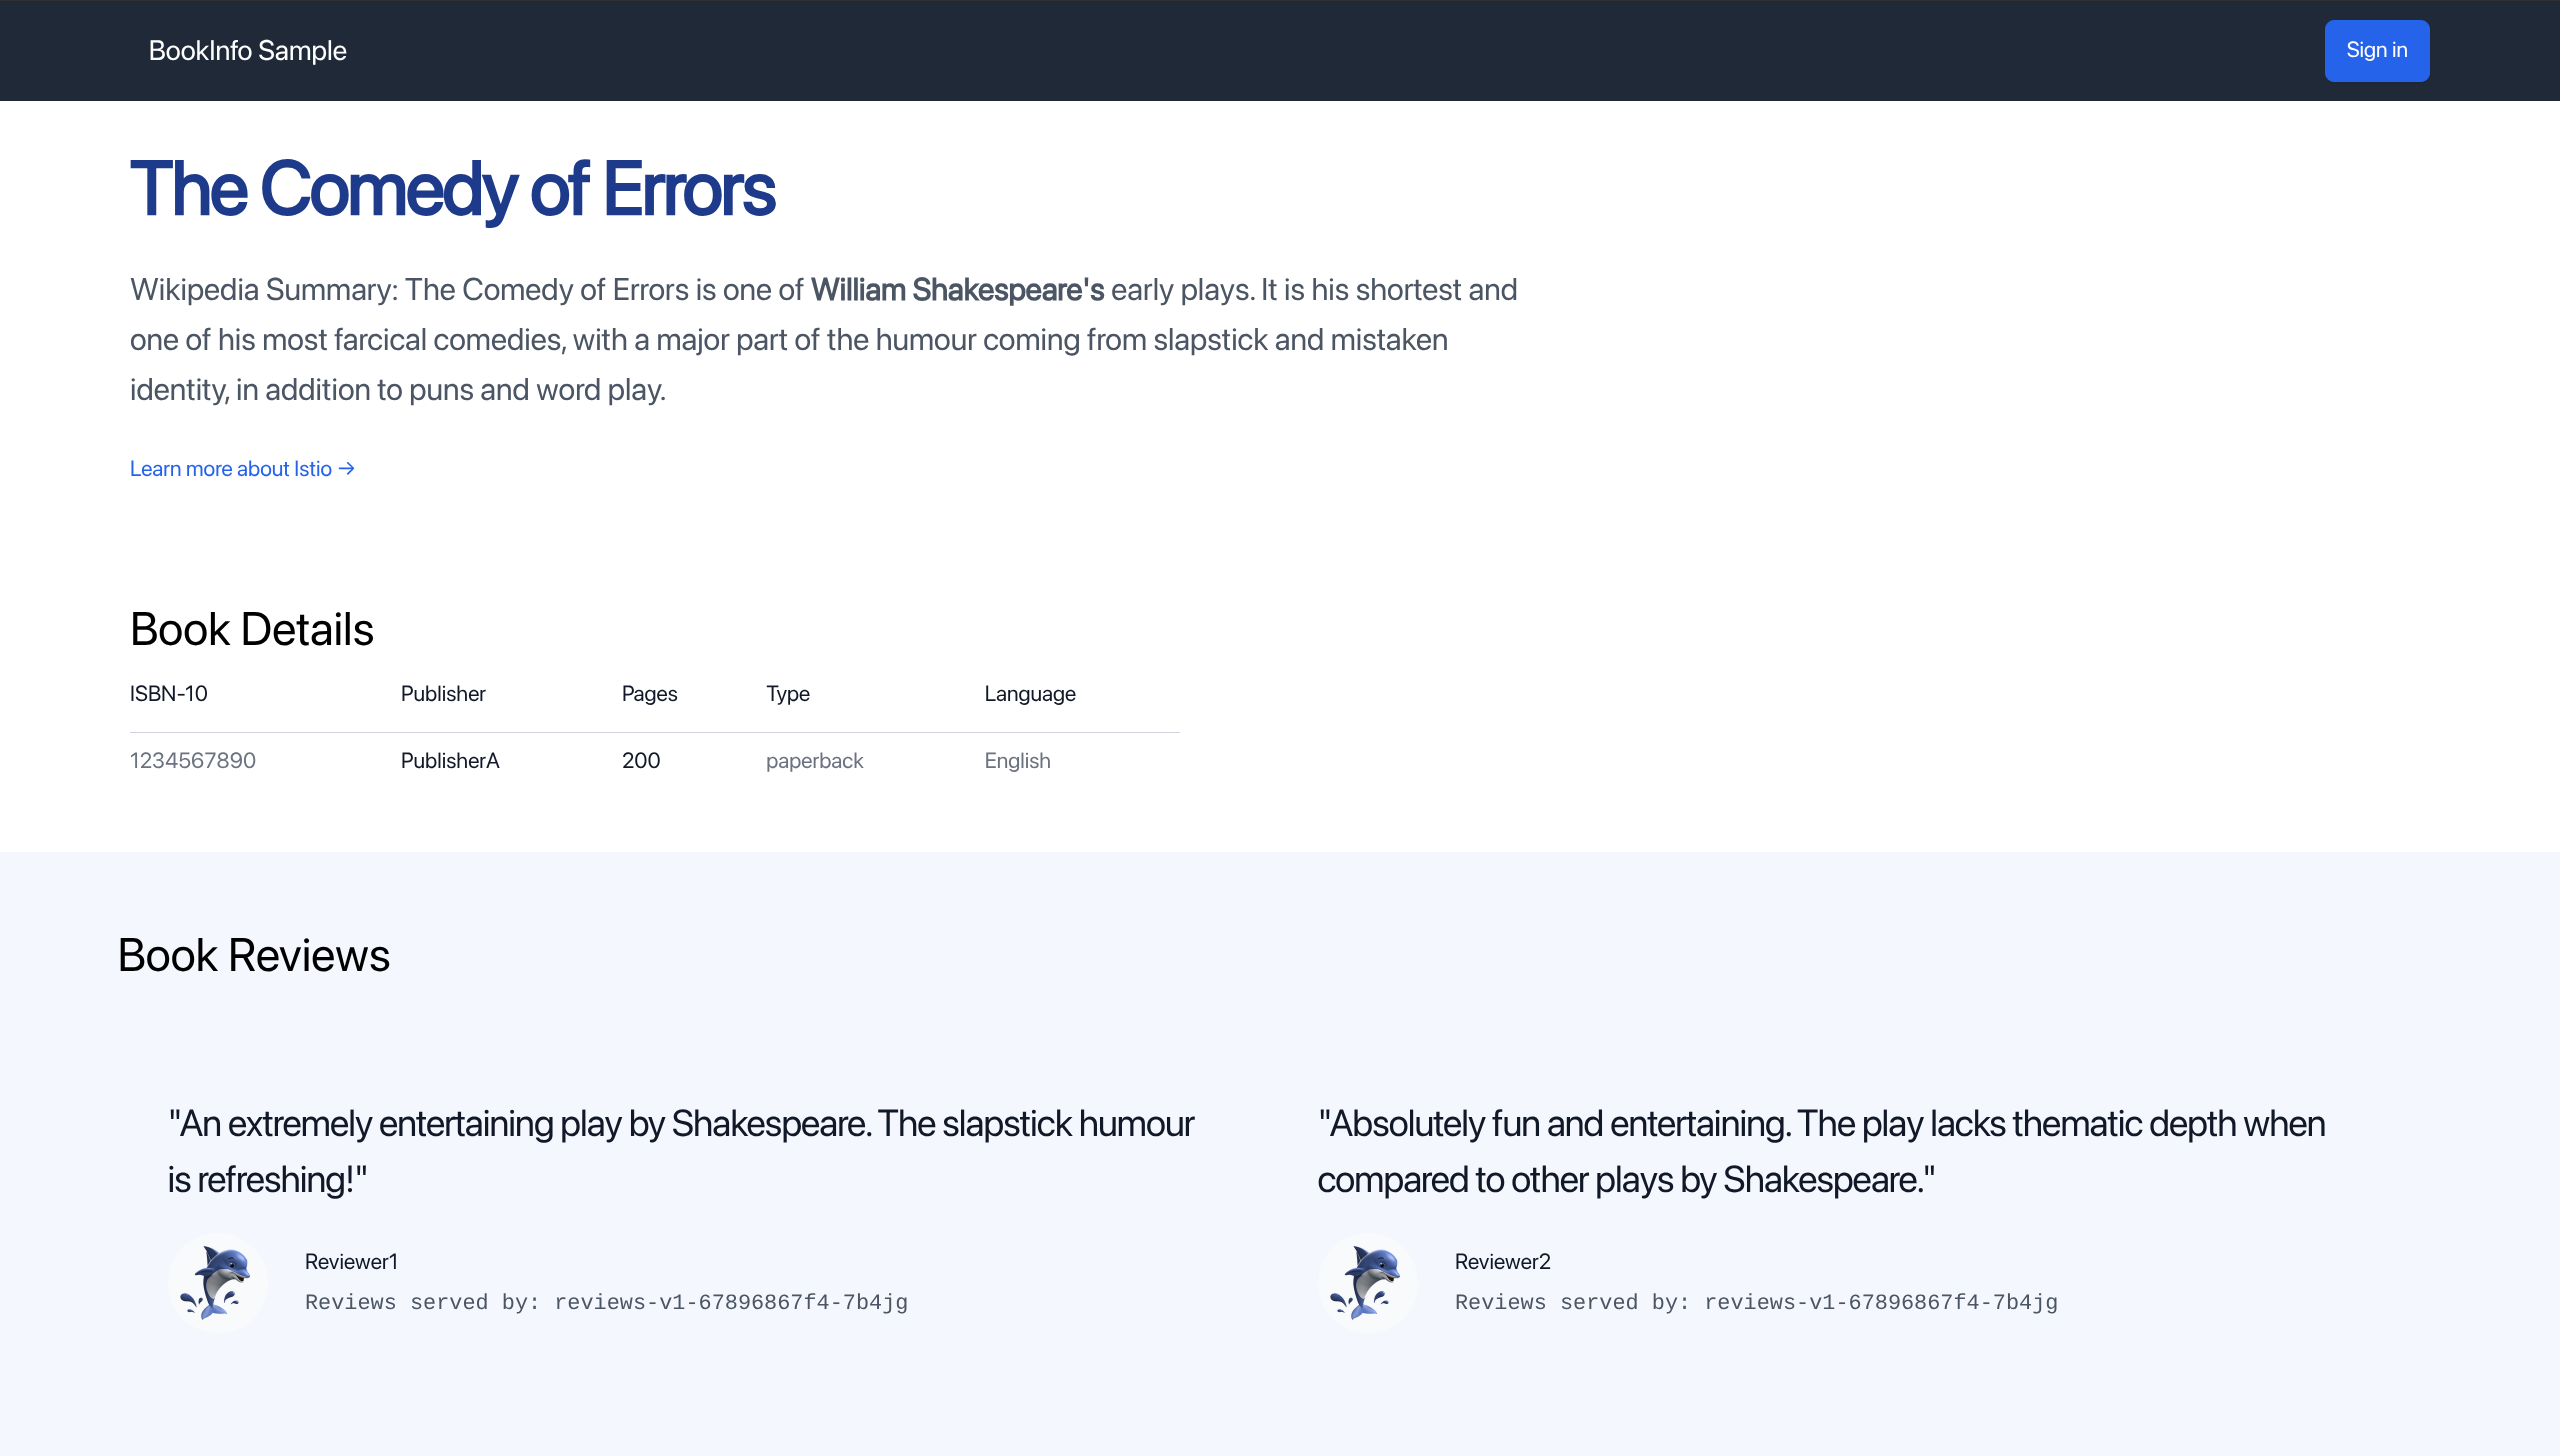
What You'll See
- Bookinfo application page
- Refresh multiple times
- Reviews section changes (red stars, black stars, no stars)
- This demonstrates traffic routing to different versions of
reviewsservice
Uninstall
istioctl uninstall --purge
kubectl delete namespace istio-system
Sidecar mode = Each pod gets 2 containers (app + Envoy proxy). The 2/2 READY count proves sidecar is injected.
Lab 2: Installing Istio Ambient Mode
What is Ambient Mode?
Ambient mode is a lightweight service mesh without sidecar proxies, resulting in lower resource usage.
Prerequisites
Same as Lab 1:
- Kubernetes cluster (Minikube, Docker Desktop, Kind, MicroK8s, or cloud)
- 16GB RAM, 4 CPUs
- Kubernetes v1.28.0 or higher
kubectlandistioctlinstalled
Installation Steps
1. Install Istio (Ambient Profile)
istioctl install --set profile=ambient --skip-confirmation
2. Check Installation
kubectl get pods -n istio-system
You should see:
istiod- Runningztunnel-xxx- Running (one per node)
No ingress/egress gateway in ambient profile by default.
3. Enable Ambient Mode for Namespace
kubectl label namespace default istio.io/dataplane-mode=ambient
4. Verify Label
kubectl get namespace -L istio.io/dataplane-mode
Testing with Bookinfo App
Deploy Sample App
kubectl apply -f https://raw.githubusercontent.com/istio/istio/release-1.24/samples/bookinfo/platform/kube/bookinfo.yaml
Check Pods
kubectl get pods
Each pod should show 1/1 READY (just app, no sidecar!)
Example Output:
NAME                          READY   STATUS
productpage-v1-xxx            1/1     Running
reviews-v1-xxx                1/1     Running
1/1 not 2/2 - no sidecar injected!
Deploy Waypoint Proxy (Optional - For L7 Features)
Install Gateway API CRDs
kubectl get crd gateways.gateway.networking.k8s.io &> /dev/null || \
  { kubectl apply -f https://github.com/kubernetes-sigs/gateway-api/releases/download/v1.2.1/standard-install.yaml; }
This command checks if Gateway API CRDs exist; if not, installs them.
Deploy Waypoint for Namespace
istioctl waypoint apply -n default --enroll-namespace
Check Waypoint
kubectl get pod
You should see waypoint proxy pod running.
Configure Ingress Access
Deploy Gateway
kubectl apply -f https://raw.githubusercontent.com/istio/istio/release-1.24/samples/bookinfo/gateway-api/bookinfo-gateway.yaml
Access Application (Minikube)
minikube tunnel
Then open browser: http://localhost/productpage
What You'll See
- Bookinfo application page
- Refresh multiple times
- Reviews section changes (different versions)
- Traffic routing works without sidecars!
Uninstall
istioctl uninstall --purge
kubectl delete namespace istio-system
Sidecar vs Ambient Comparison
| Feature | Sidecar (Lab 1) | Ambient (Lab 2) |
|---|---|---|
| Pods READY count | 2/2 | 1/1 |
| Proxy location | Per pod | Per node (ztunnel) |
| Resource usage | Higher | Lower |
| L4 traffic | Sidecar | ztunnel |
| L7 traffic | Sidecar | waypoint proxy |
| Label | istio-injection=enabled | istio.io/dataplane-mode=ambient |
| Profile | demo | ambient |
Ambient mode = No sidecars. Pods show 1/1 READY. Uses ztunnel (L4) + optional waypoint (L7). Less overhead, same features.
Observability and Prometheus
What is Observability?
Observability is the ability to see what's happening inside your service mesh - like having eyes on your traffic.
How Istio Collects Data
| Mode | Collection Method | Layer |
|---|---|---|
| Sidecar | Envoy proxy intercepts traffic | L4 + L7 |
| Ambient | ztunnel (L4) + waypoint proxy (L7) | L4 and L7 |
Three Types of Telemetry
| Type | Description | Example |
|---|---|---|
| Metrics | Numbers and statistics | Requests, errors, latency |
| Distributed Traces | Request path across services | Full journey tracking |
| Access Logs | Access records | Who accessed what and when |
Metrics: The Four Golden Signals
1. Latency
How long requests take to complete
- Success latency (HTTP 200)
- Failure latency (HTTP 500)
2. Traffic
How many requests hit your system
- Requests per second
- Concurrent sessions
3. Errors
How many requests fail
- HTTP 500s count
- Error rate percentage
4. Saturation
How full your resources are
- CPU usage
- Memory usage
- Thread pool utilization
| Signal | Measures | Key Metrics |
|---|---|---|
| Latency | Response time | p50, p95, p99 |
| Traffic | Request volume | RPS, concurrent users |
| Errors | Failure rate | 4xx, 5xx counts |
| Saturation | Resource usage | CPU%, Memory% |
Three Levels of Metrics
1. Proxy-Level Metrics (Most Detailed)
Collection:
- Sidecar Mode: Envoy proxy collects data
- Ambient Mode: ztunnel and waypoint collect data
Example metrics:
envoy_cluster_internal_upstream_rq{response_code_class="2xx"} 7163
envoy_cluster_upstream_rq_completed{cluster_name="xds-grpc"} 7164
Access: /stats endpoint on Envoy proxy
2. Service-Level Metrics (Most Useful)
Tracks communication between services and covers all 4 golden signals.
Example:
istio_requests_total{
  response_code="200",
  source_workload="istio-ingressgateway",
  destination_workload="web-frontend",
  request_protocol="http"
} 9
Istio sends these to Prometheus automatically.
3. Control Plane Metrics
Monitors Istio itself (not your applications).
Examples:
- Conflicting listeners count
- Clusters without instances
- Rejected configurations
Metrics Level Comparison
| Level | Scope | Detail | Use Case |
|---|---|---|---|
| Proxy | Individual proxy | Highest | Deep debugging |
| Service | Service-to-service | Medium | Daily monitoring |
| Control Plane | Istio components | Low | Istio health |
Prometheus
What is Prometheus?
Prometheus is an open-source monitoring tool that stores and queries metrics - a time series database for numbers.
Install Prometheus
kubectl apply -f https://raw.githubusercontent.com/istio/istio/release-1.24/samples/addons/prometheus.yaml
Open Dashboard
istioctl dashboard prometheus
Then open browser: http://localhost:9090
Testing Observability (Hands-on)
1. Deploy Sample Apps
# Deploy httpbin (receives requests)
kubectl apply -f https://raw.githubusercontent.com/istio/istio/release-1.24/samples/httpbin/httpbin.yaml

# Deploy sleep (sends requests)
kubectl apply -f https://raw.githubusercontent.com/istio/istio/release-1.24/samples/sleep/sleep.yaml
2. Check Pods
kubectl get pods -n default
| Mode | READY Count | Traffic Path |
|---|---|---|
| Sidecar | 2/2 | Through sidecar |
| Ambient | 1/1 | Through ztunnel |
3. Generate Traffic
# Single request
kubectl exec deploy/sleep -c sleep -- curl -sS http://httpbin:8000/get

# Multiple requests (20 times)
for i in {1..20}; do
  kubectl exec deploy/sleep -c sleep -- curl -sS http://httpbin:8000/get
  sleep 0.5
done
4. View Metrics in Prometheus
Open Prometheus dashboard and search for:
istio_requests_total
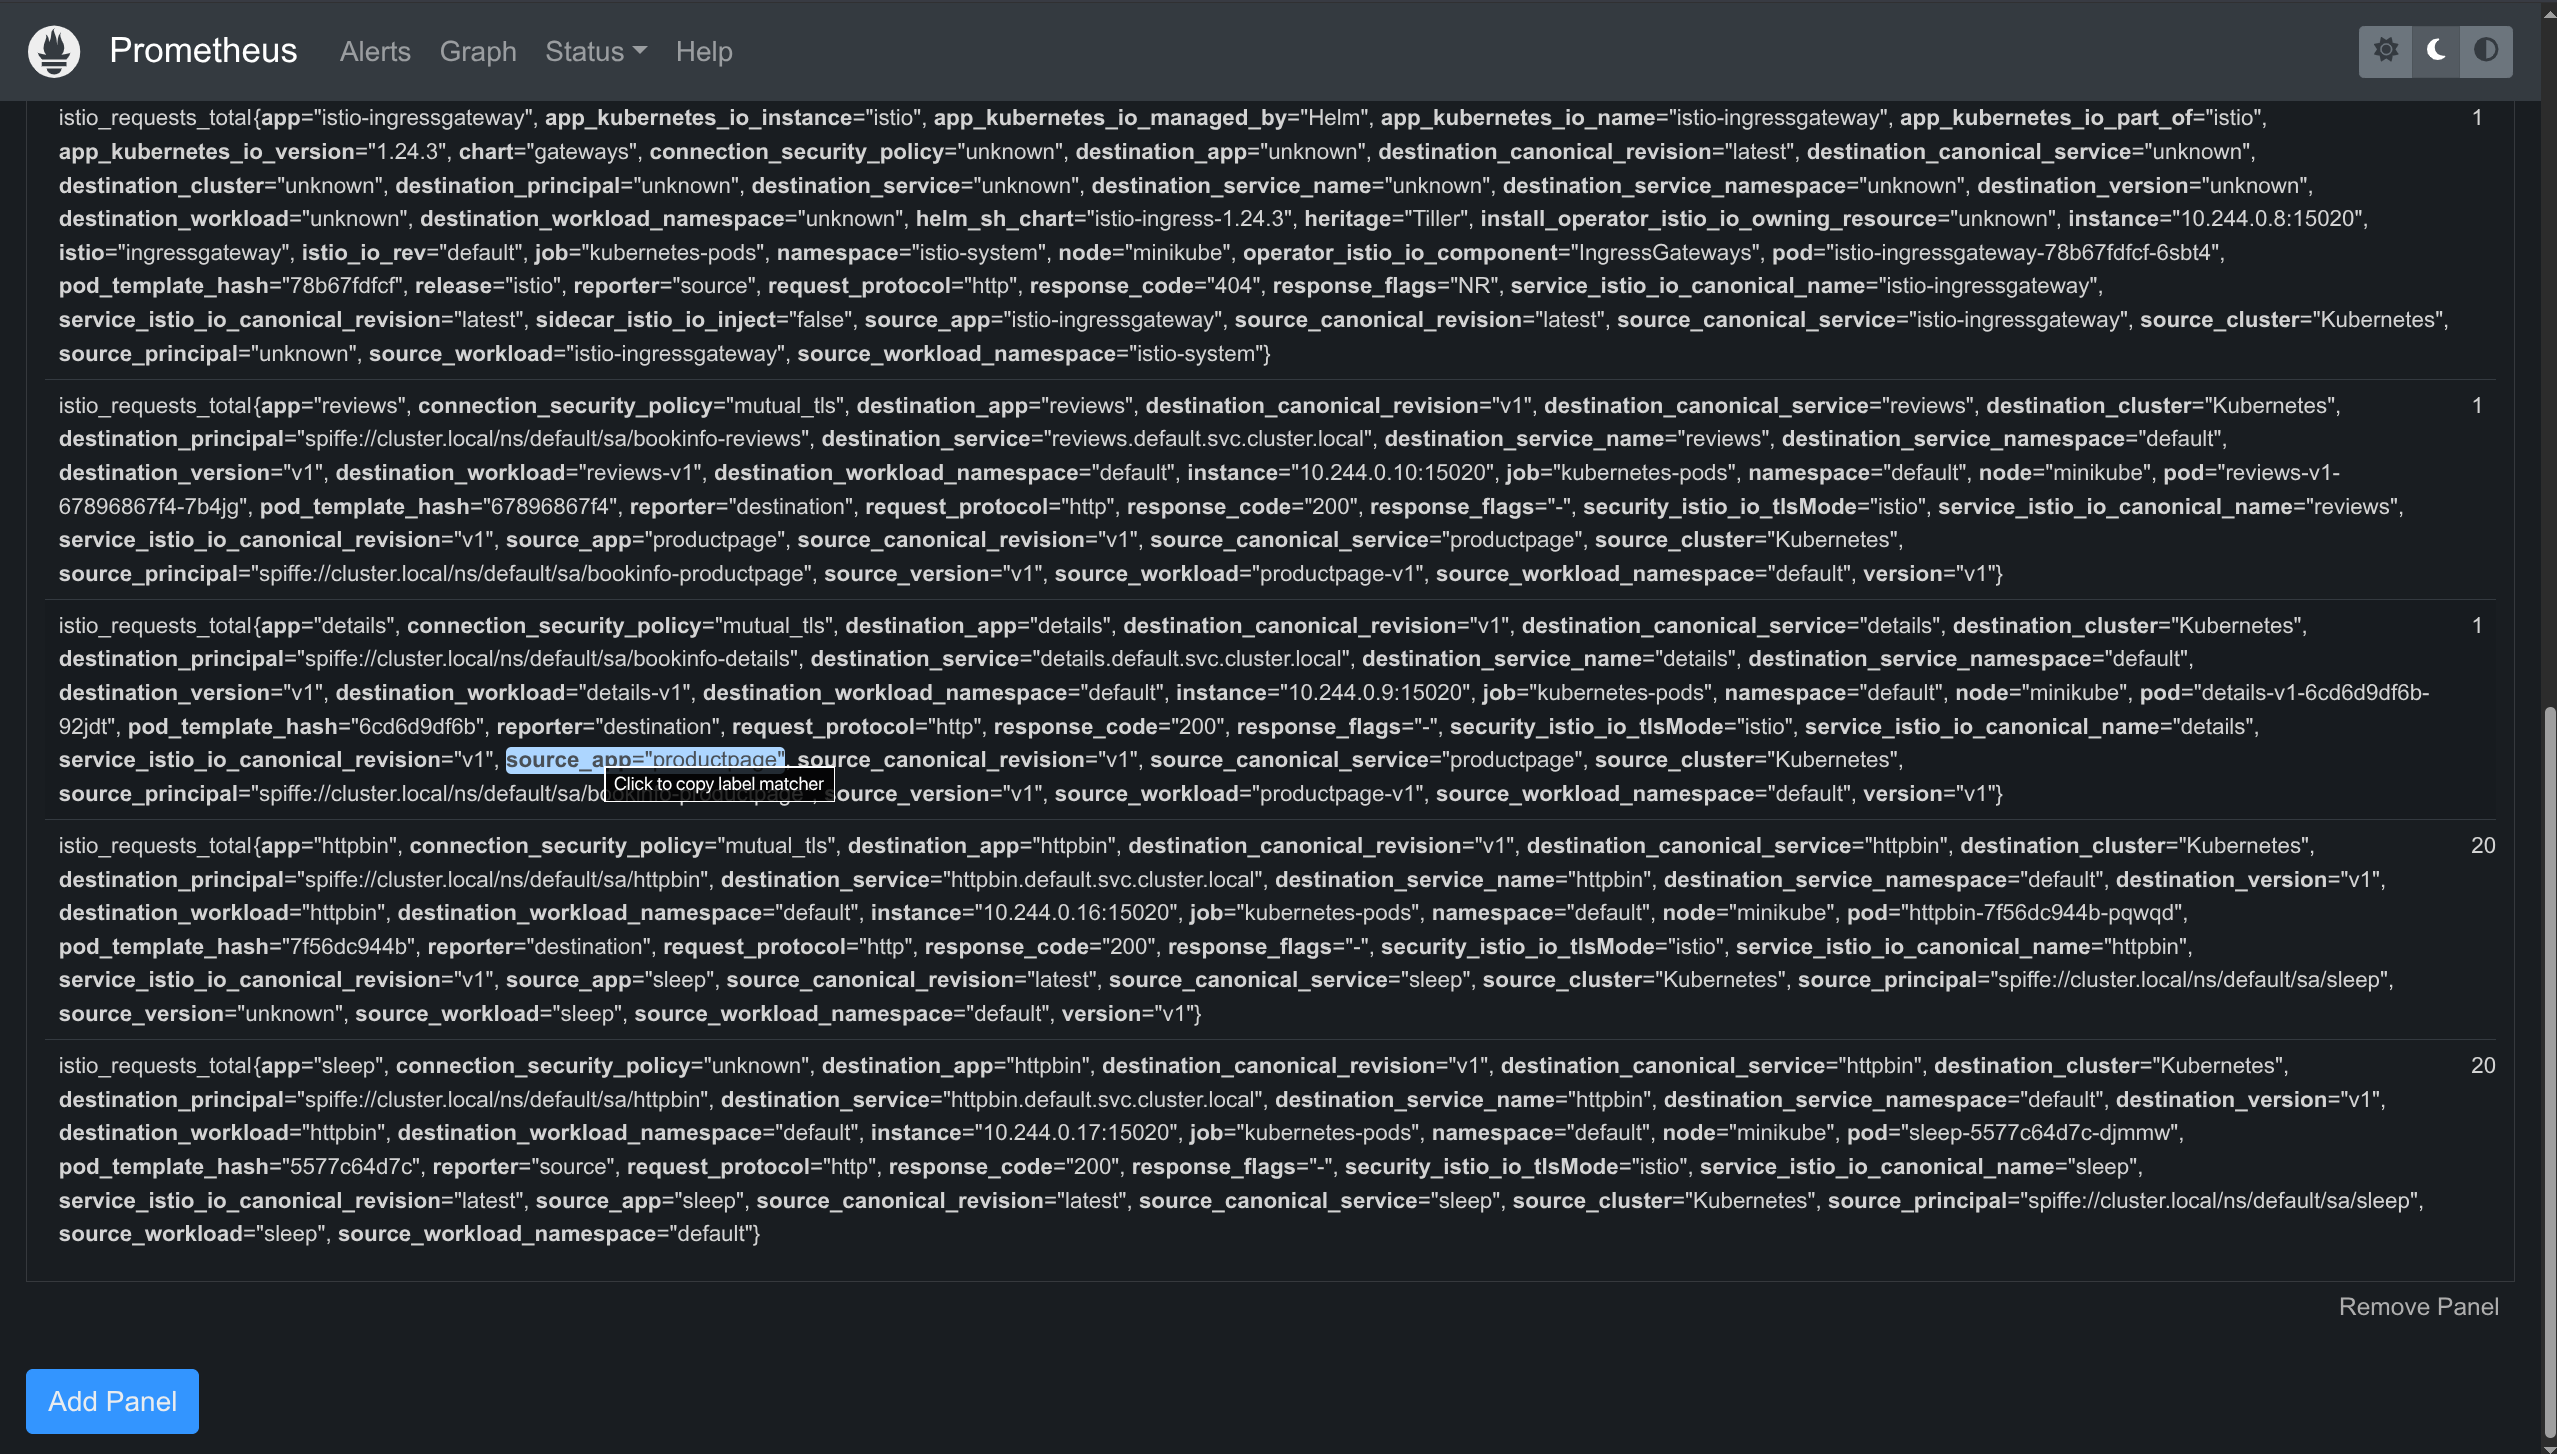
You'll see all requests from sleep to httpbin with details:
- Response codes
- Source/destination workloads
- Protocol used
- Connection security
Observability = Seeing what's happening in your mesh
Three types: Metrics (numbers), Traces (request path), Logs (access records)
Four golden signals: Latency, Traffic, Errors, Saturation
Prometheus = Tool to store and view metrics
Works in both modes: Sidecar (via Envoy) and Ambient (via ztunnel/waypoint)
Grafana
What is Grafana?
Grafana is an open-source tool to visualize metrics. It takes data from Prometheus and displays it in graphs, tables, and charts.
Purpose: Monitor health of Istio and your applications in the mesh.
Prerequisites
Must install Prometheus first! Grafana uses Prometheus as its data source.
Install Grafana
kubectl apply -f https://raw.githubusercontent.com/istio/istio/release-1.24/samples/addons/grafana.yaml
This is for learning only, NOT for production (not tuned for performance/security).
Open Grafana Dashboard
istioctl dashboard grafana
Then open browser: http://localhost:3000
Navigate to istio folder to see all dashboards.
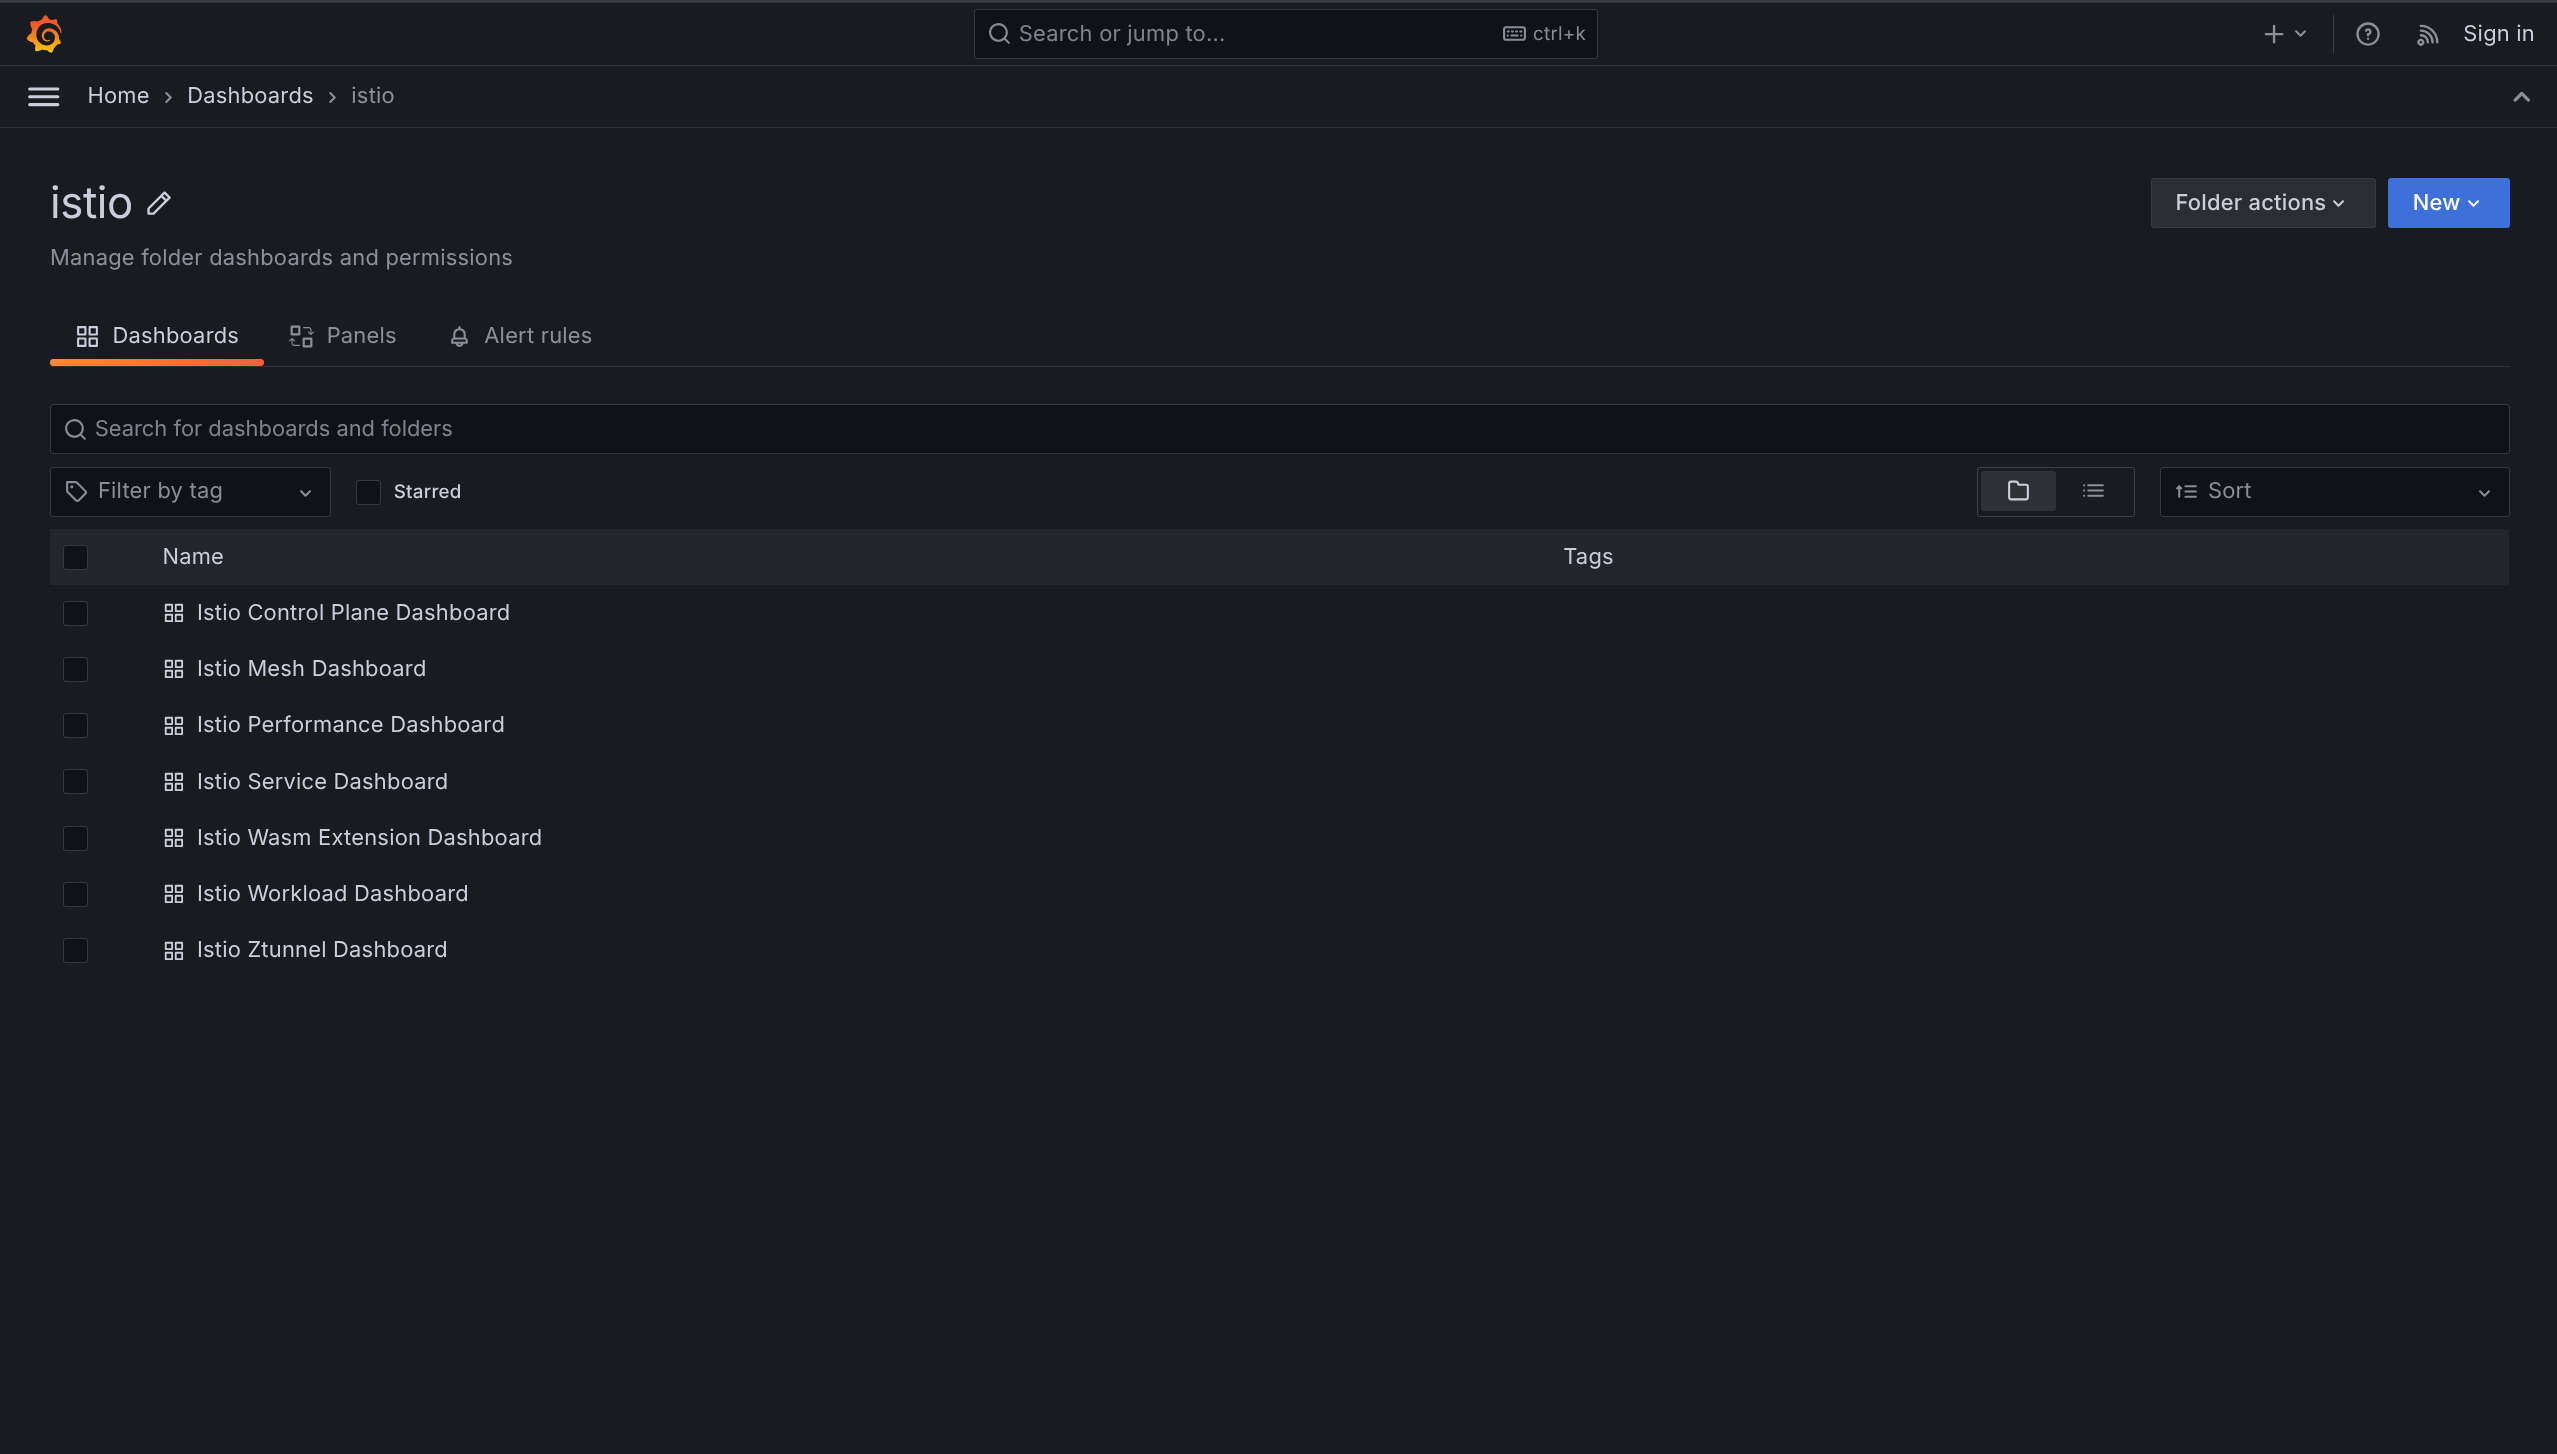
Pre-configured Dashboards (7 Total)
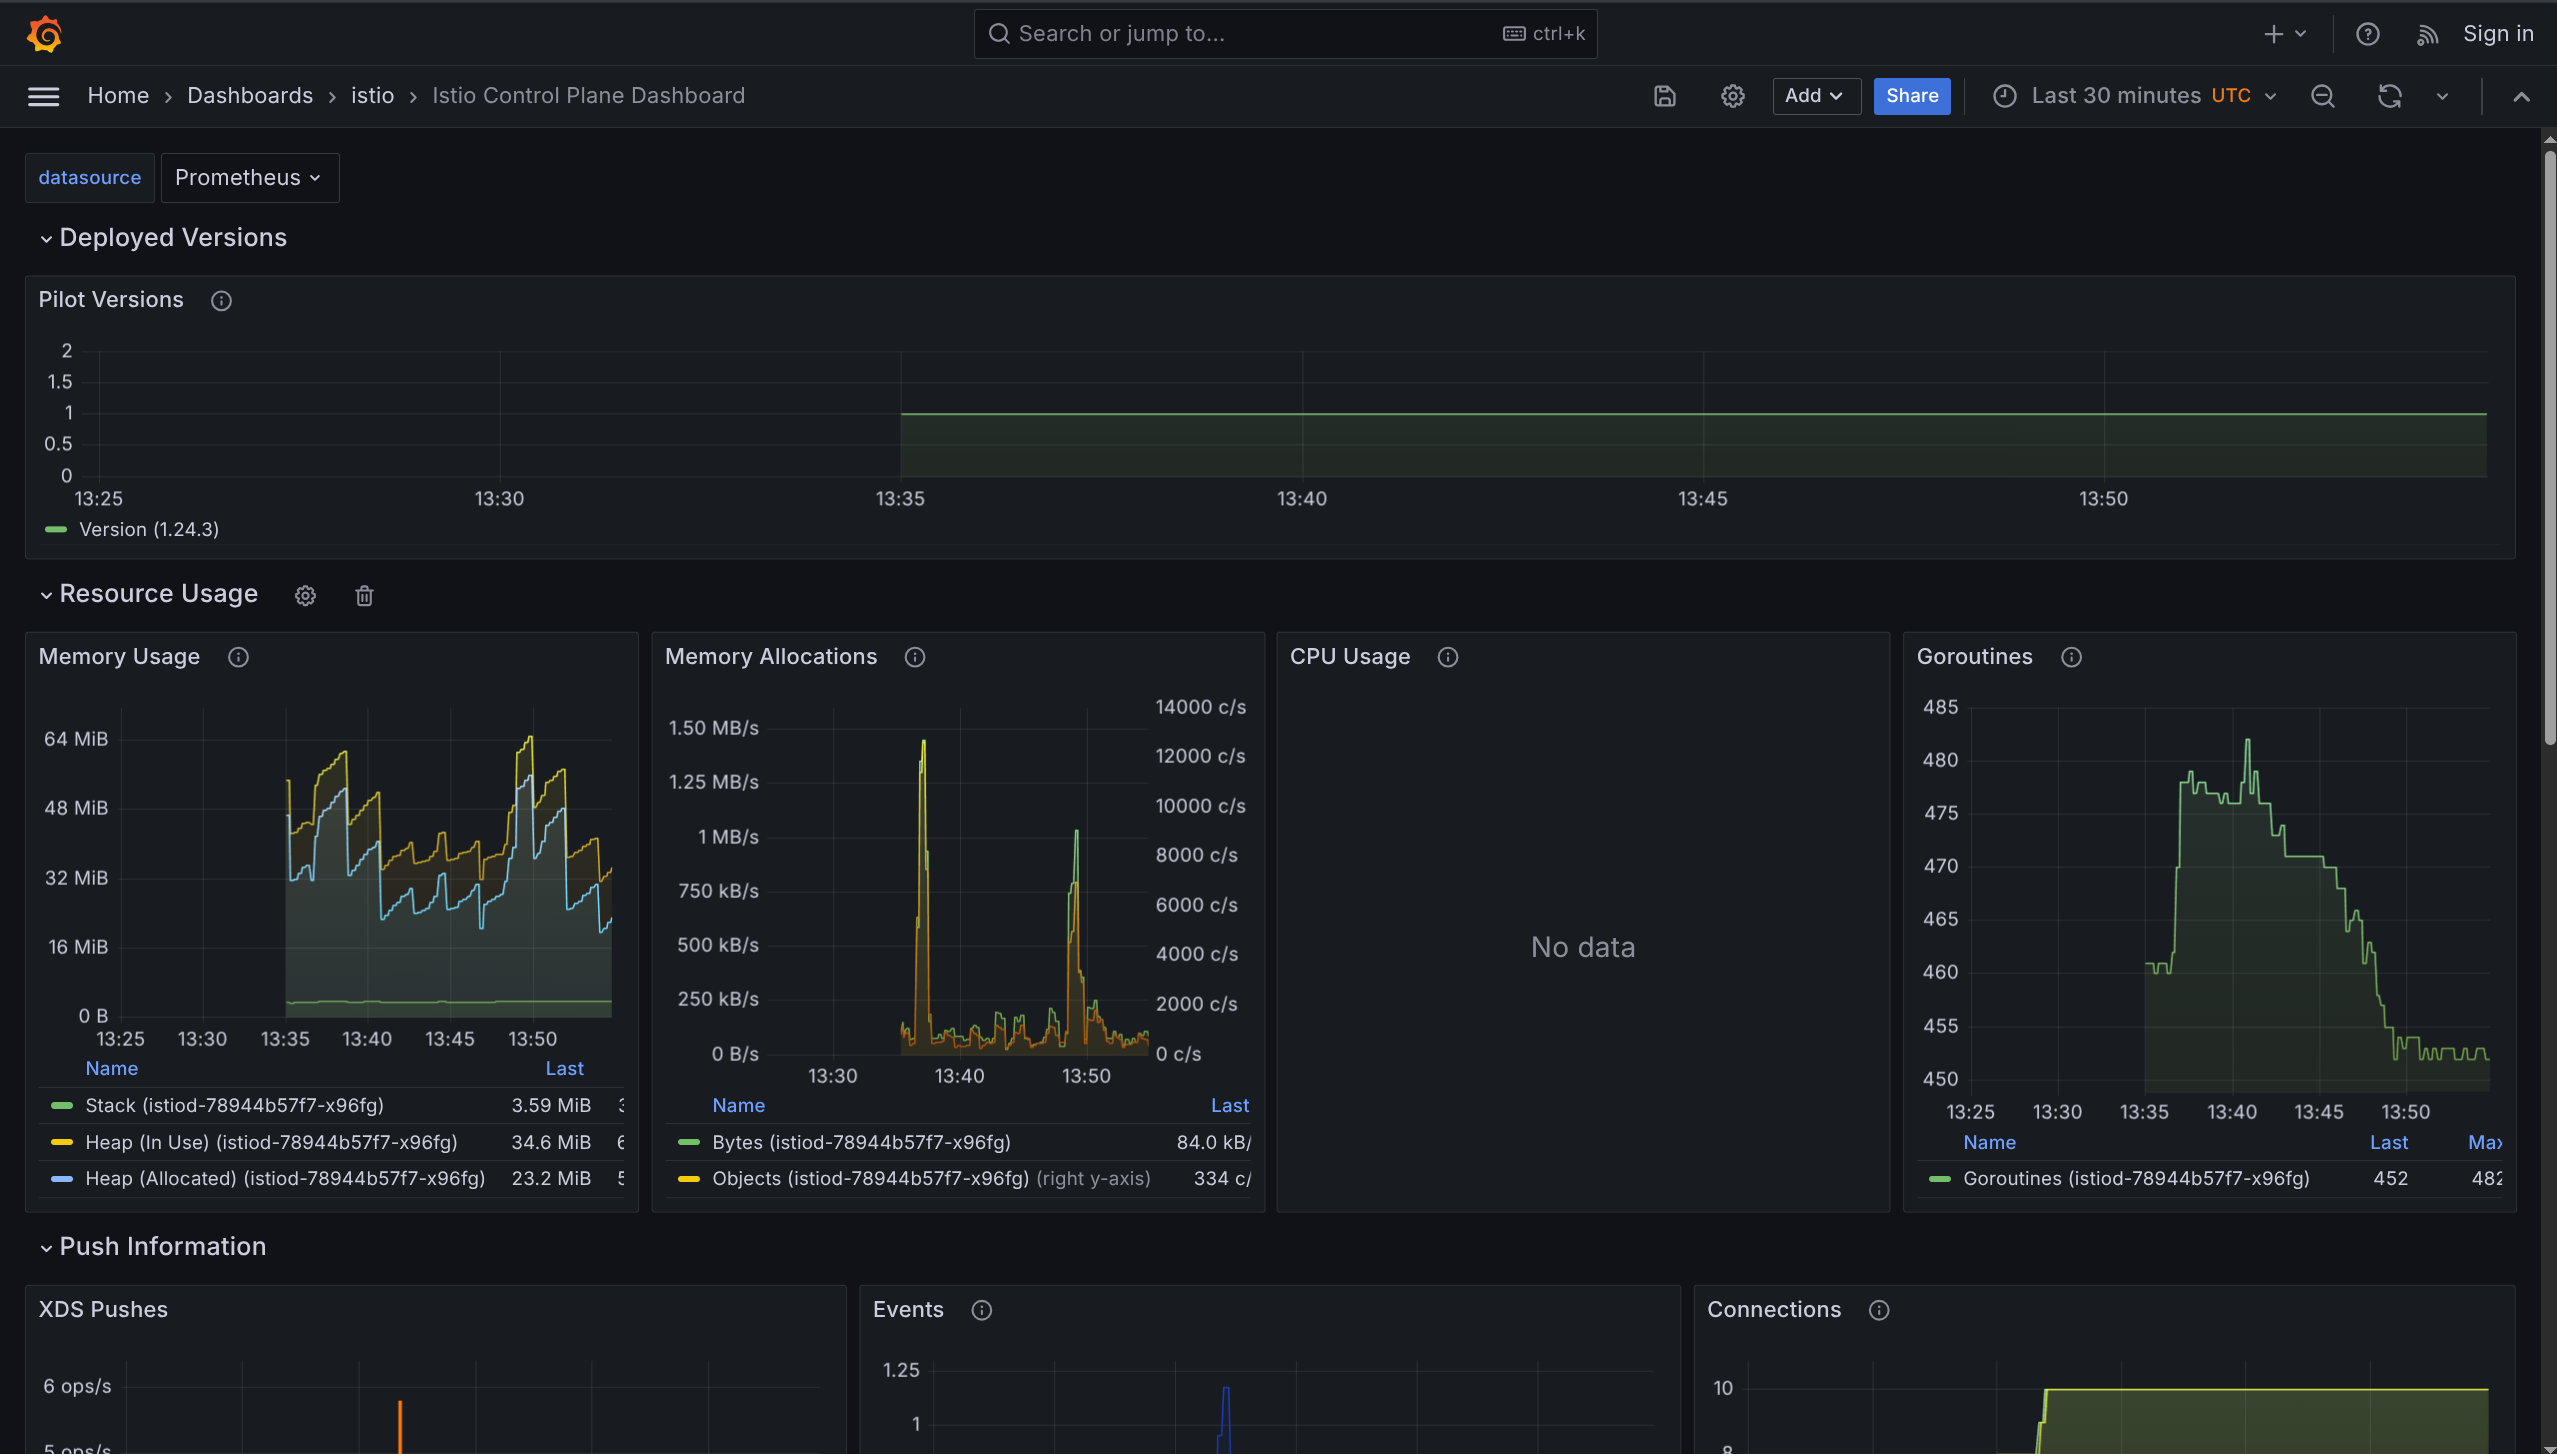
1. Istio Control Plane Dashboard
What it shows: Health of Istio control plane itself
Monitors:
- CPU, memory, disk usage
- Pilot metrics
- Envoy statistics
- Webhook status
Use when: Checking if Istio control plane is healthy
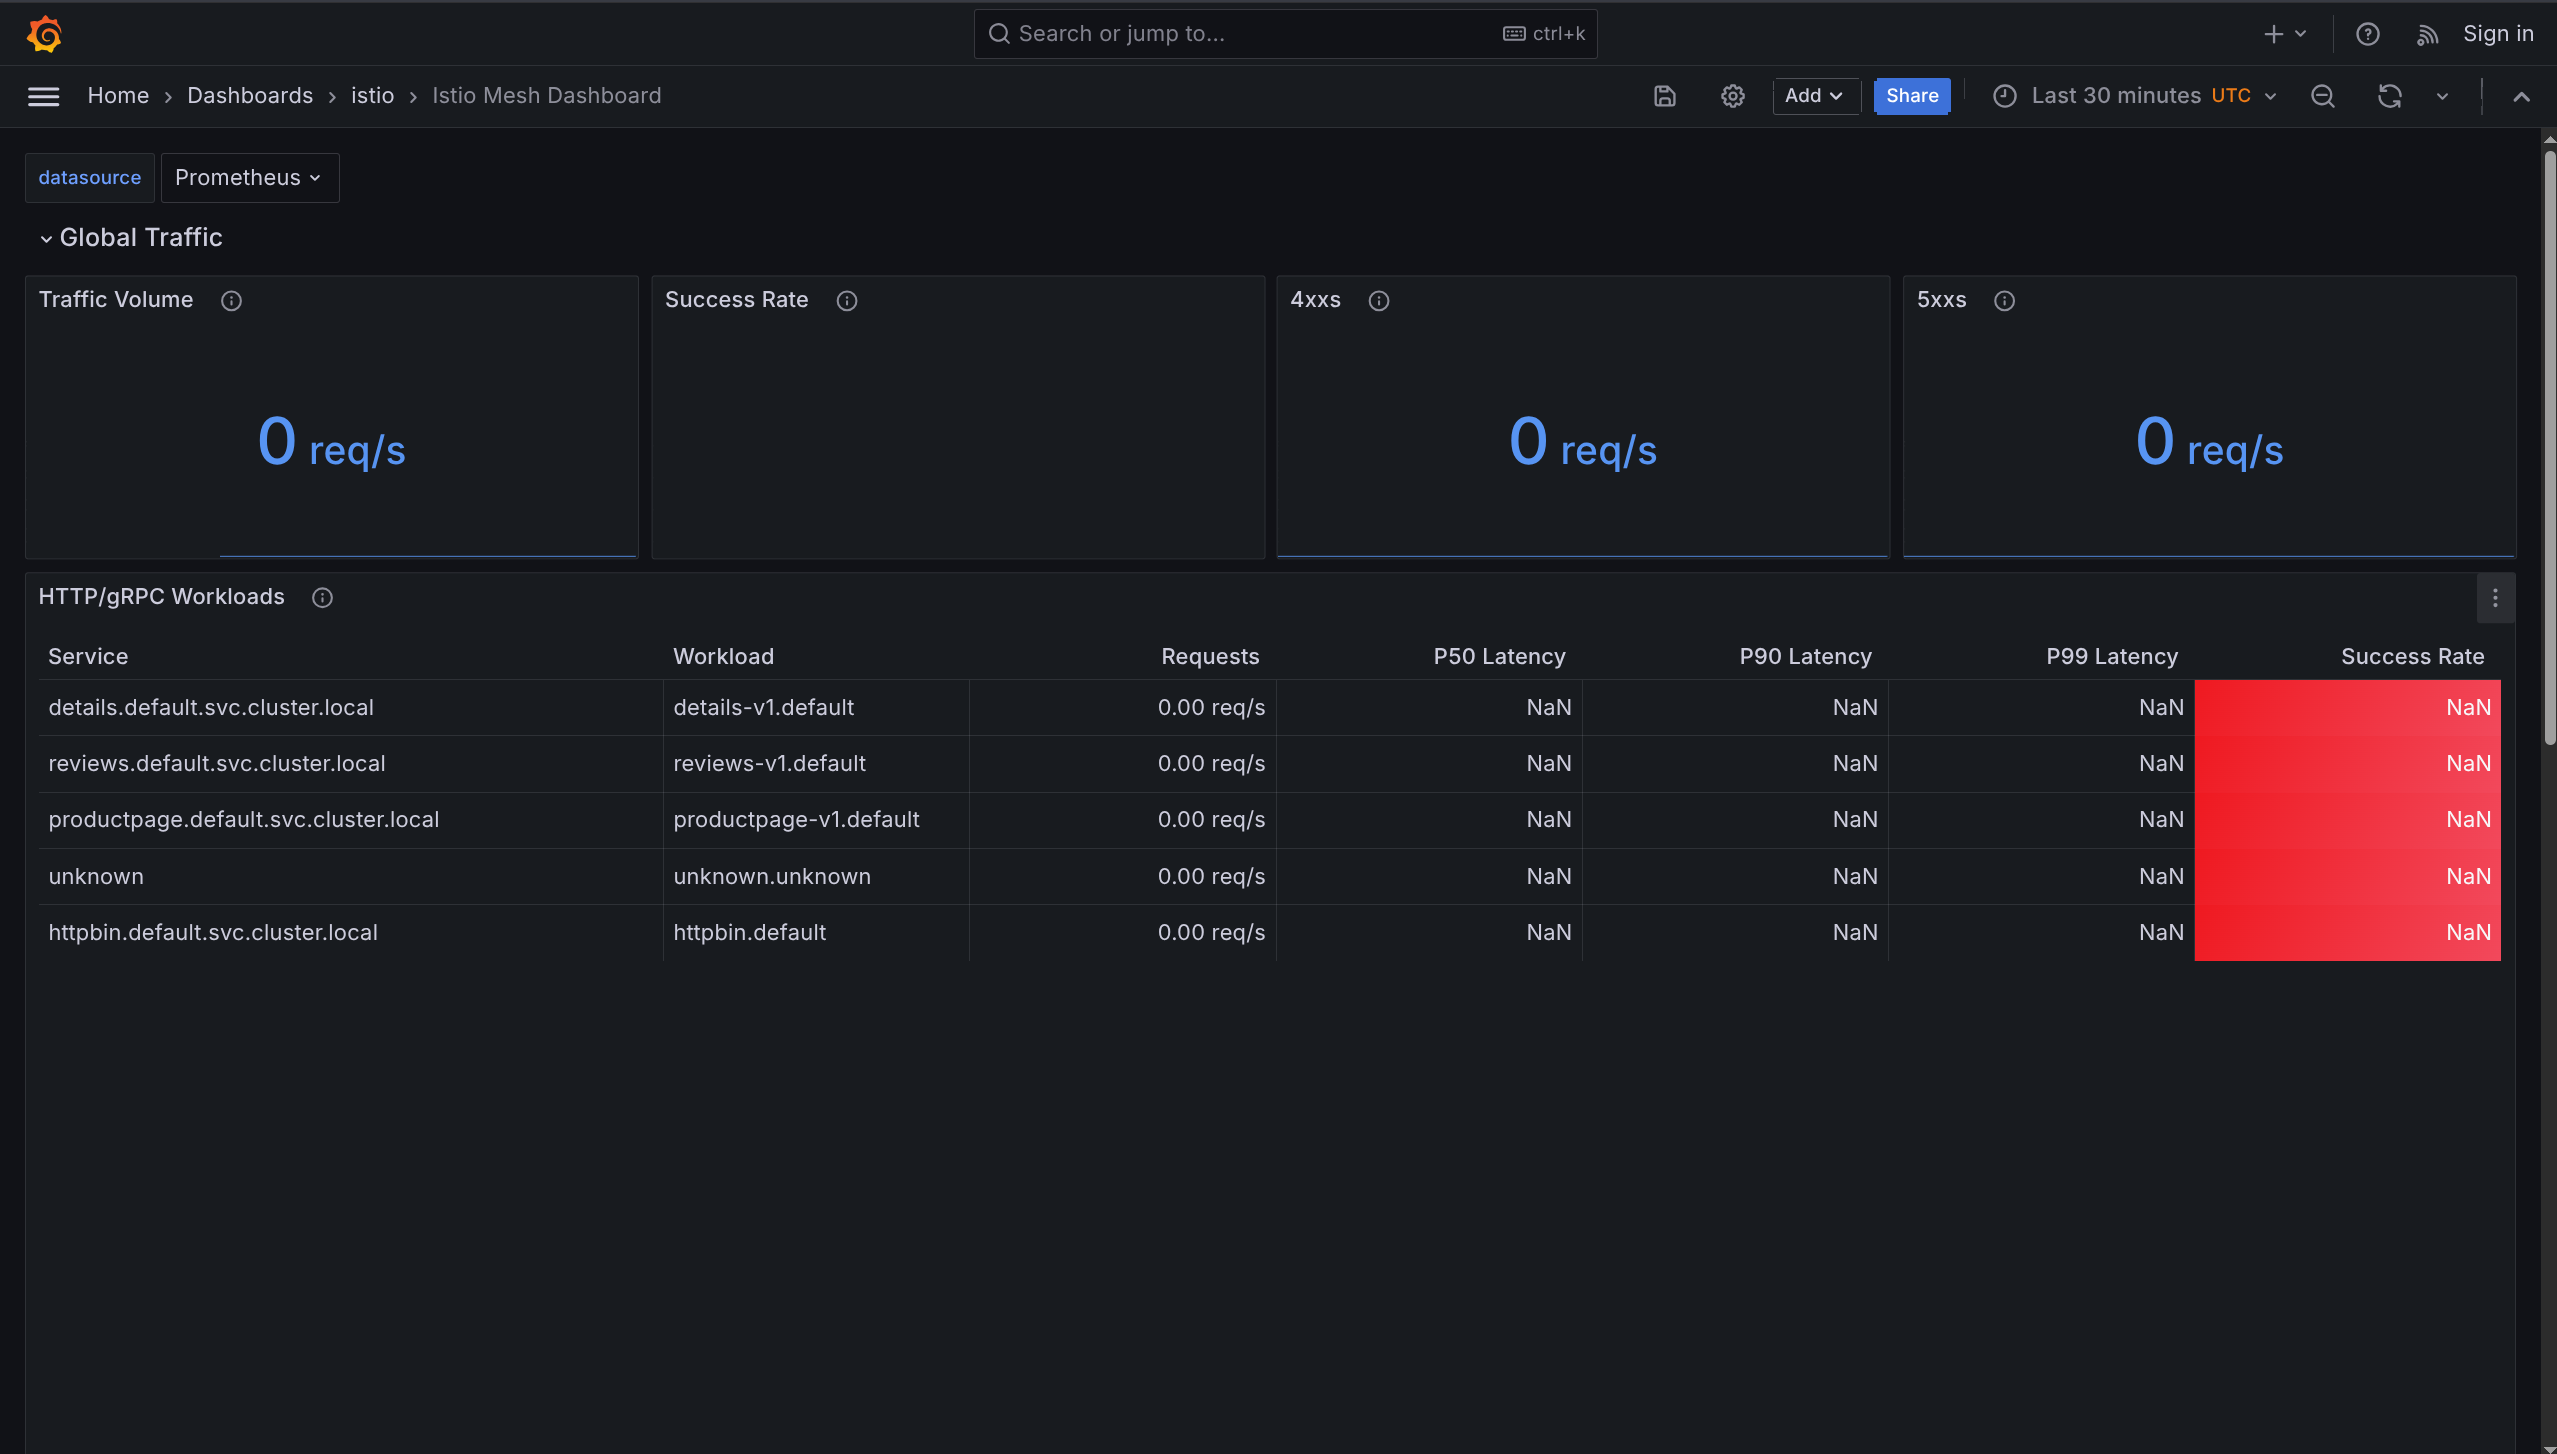
2. Istio Mesh Dashboard
What it shows: Overview of ALL services in mesh
Monitors:
- Global request volume
- Success rate
- HTTP 4xx errors (client errors)
- HTTP 5xx errors (server errors)
Use when: Getting big picture of entire mesh health
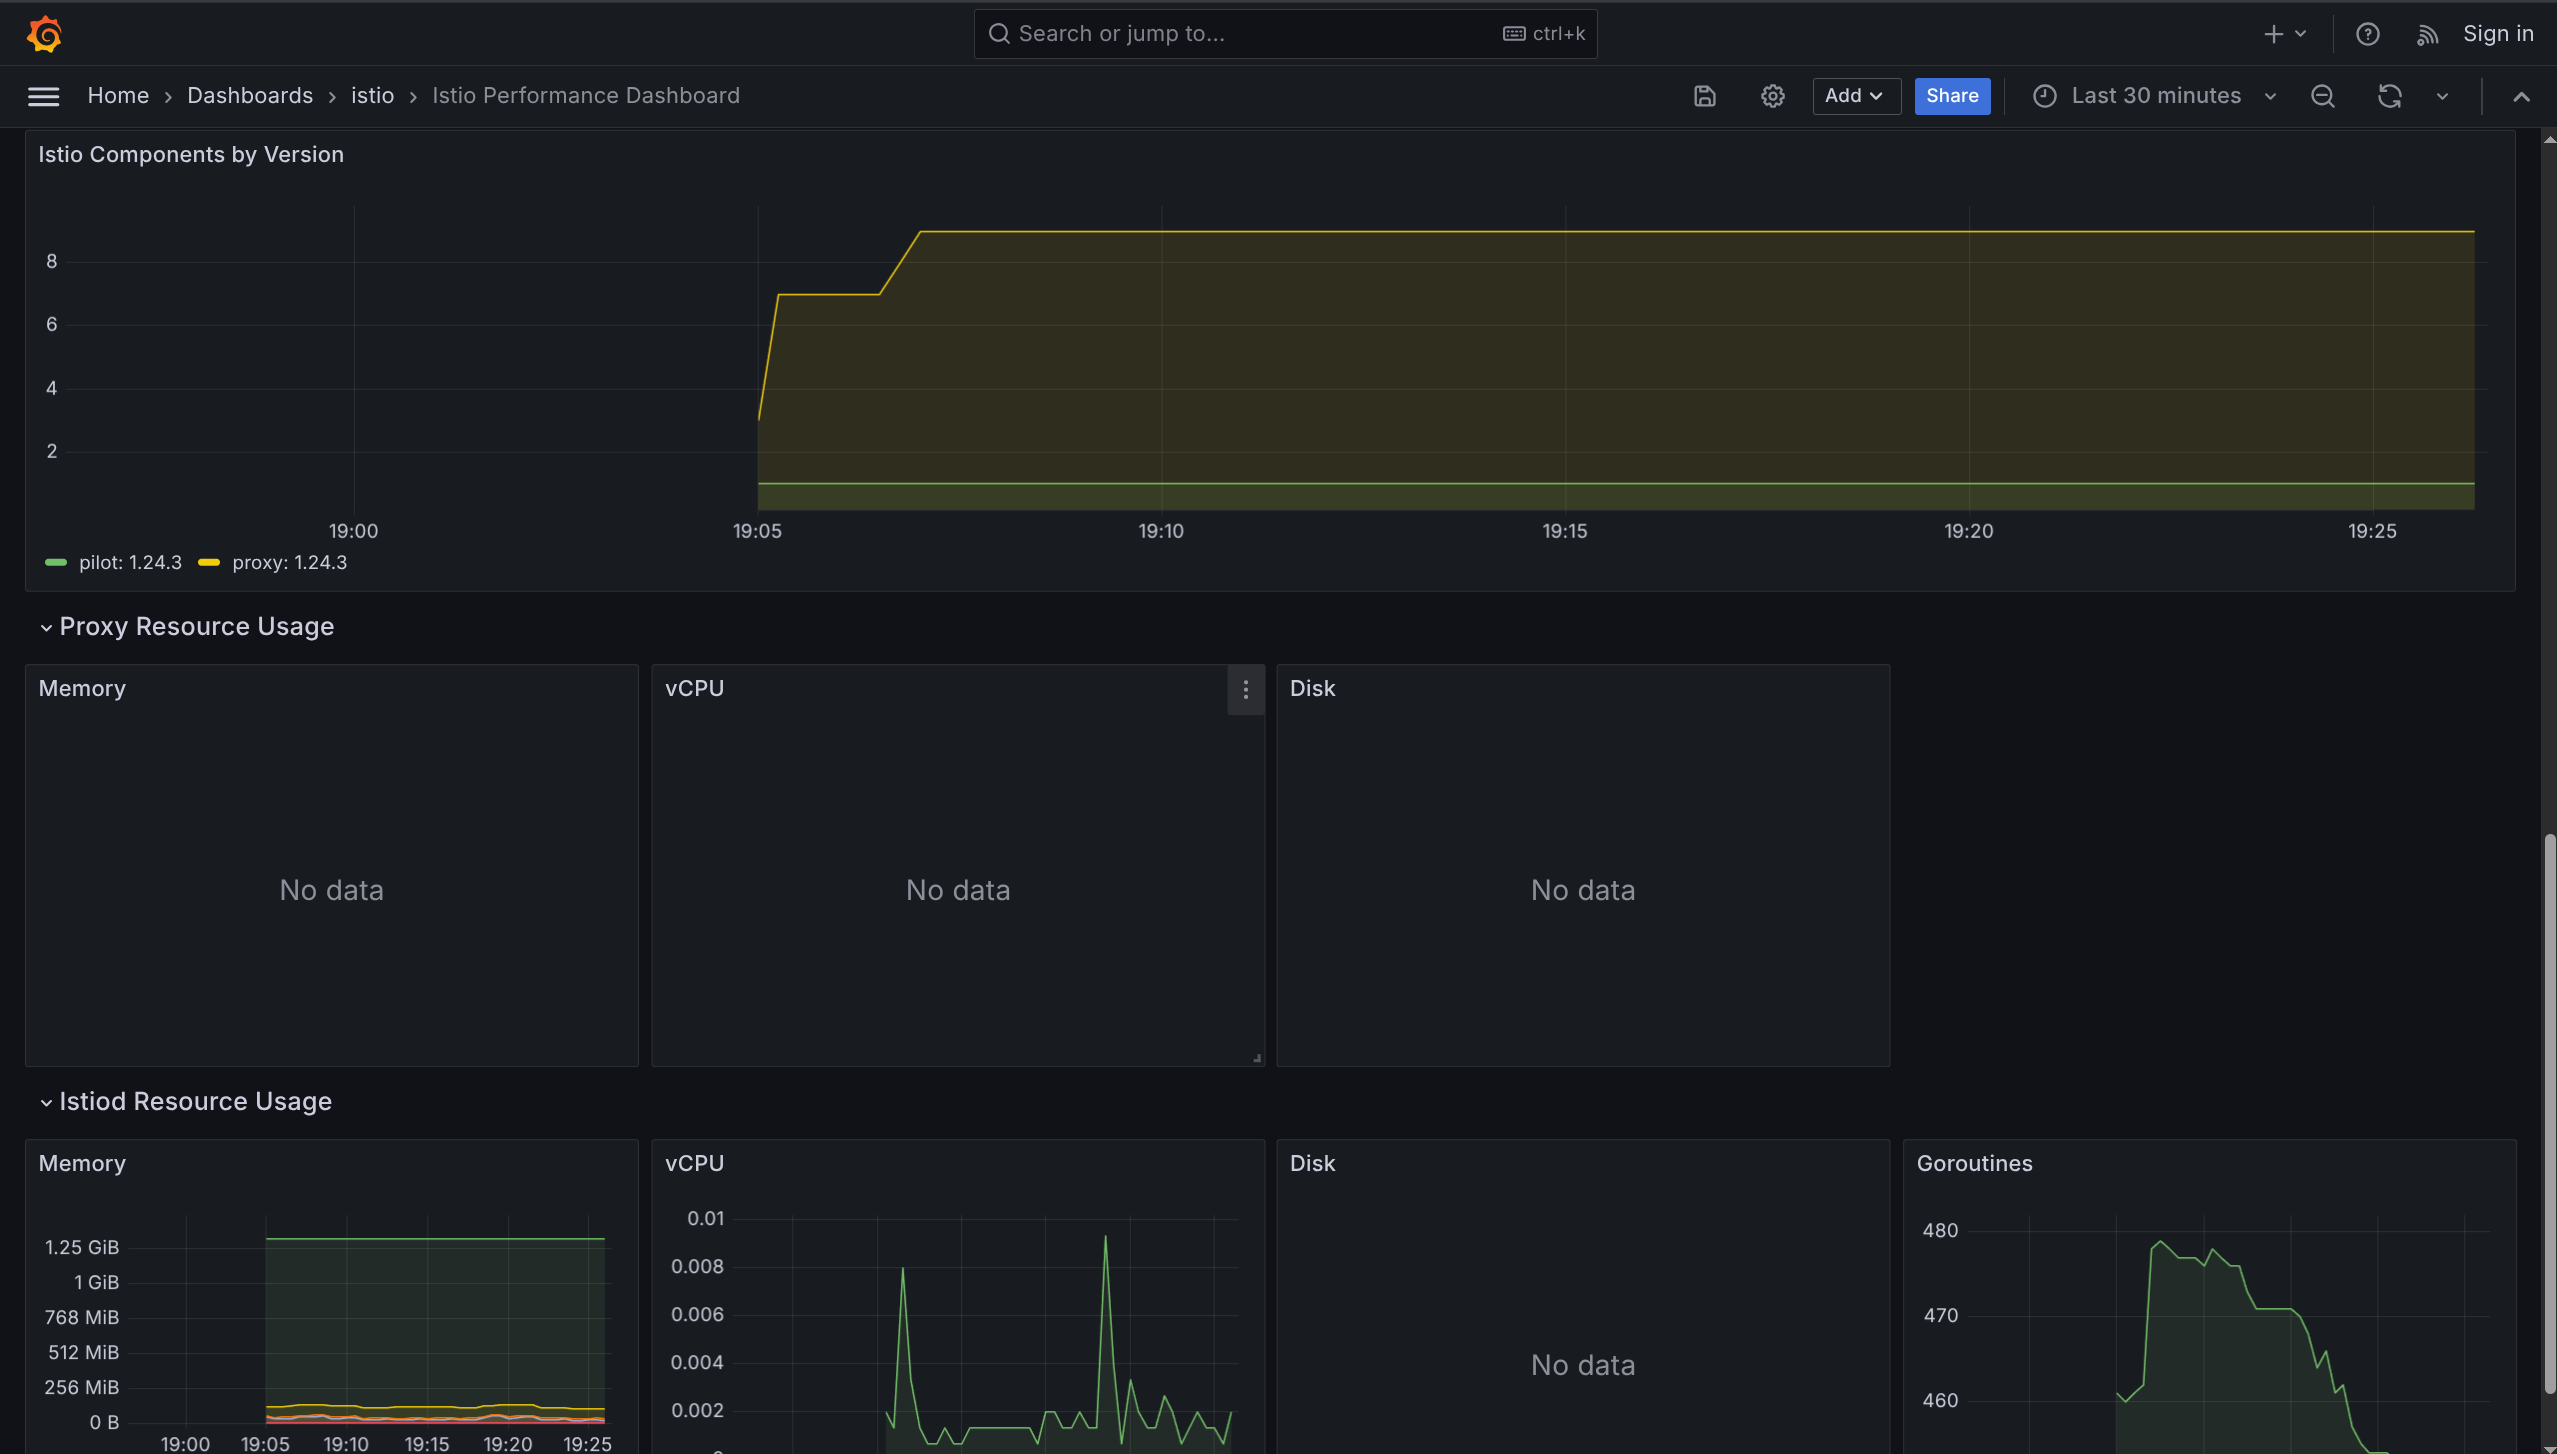
3. Istio Performance Dashboard
What it shows: How much resources Istio uses
Monitors:
- Resource utilization under load
- Overhead added by Istio
Use when: Checking if Istio is using too much CPU/memory
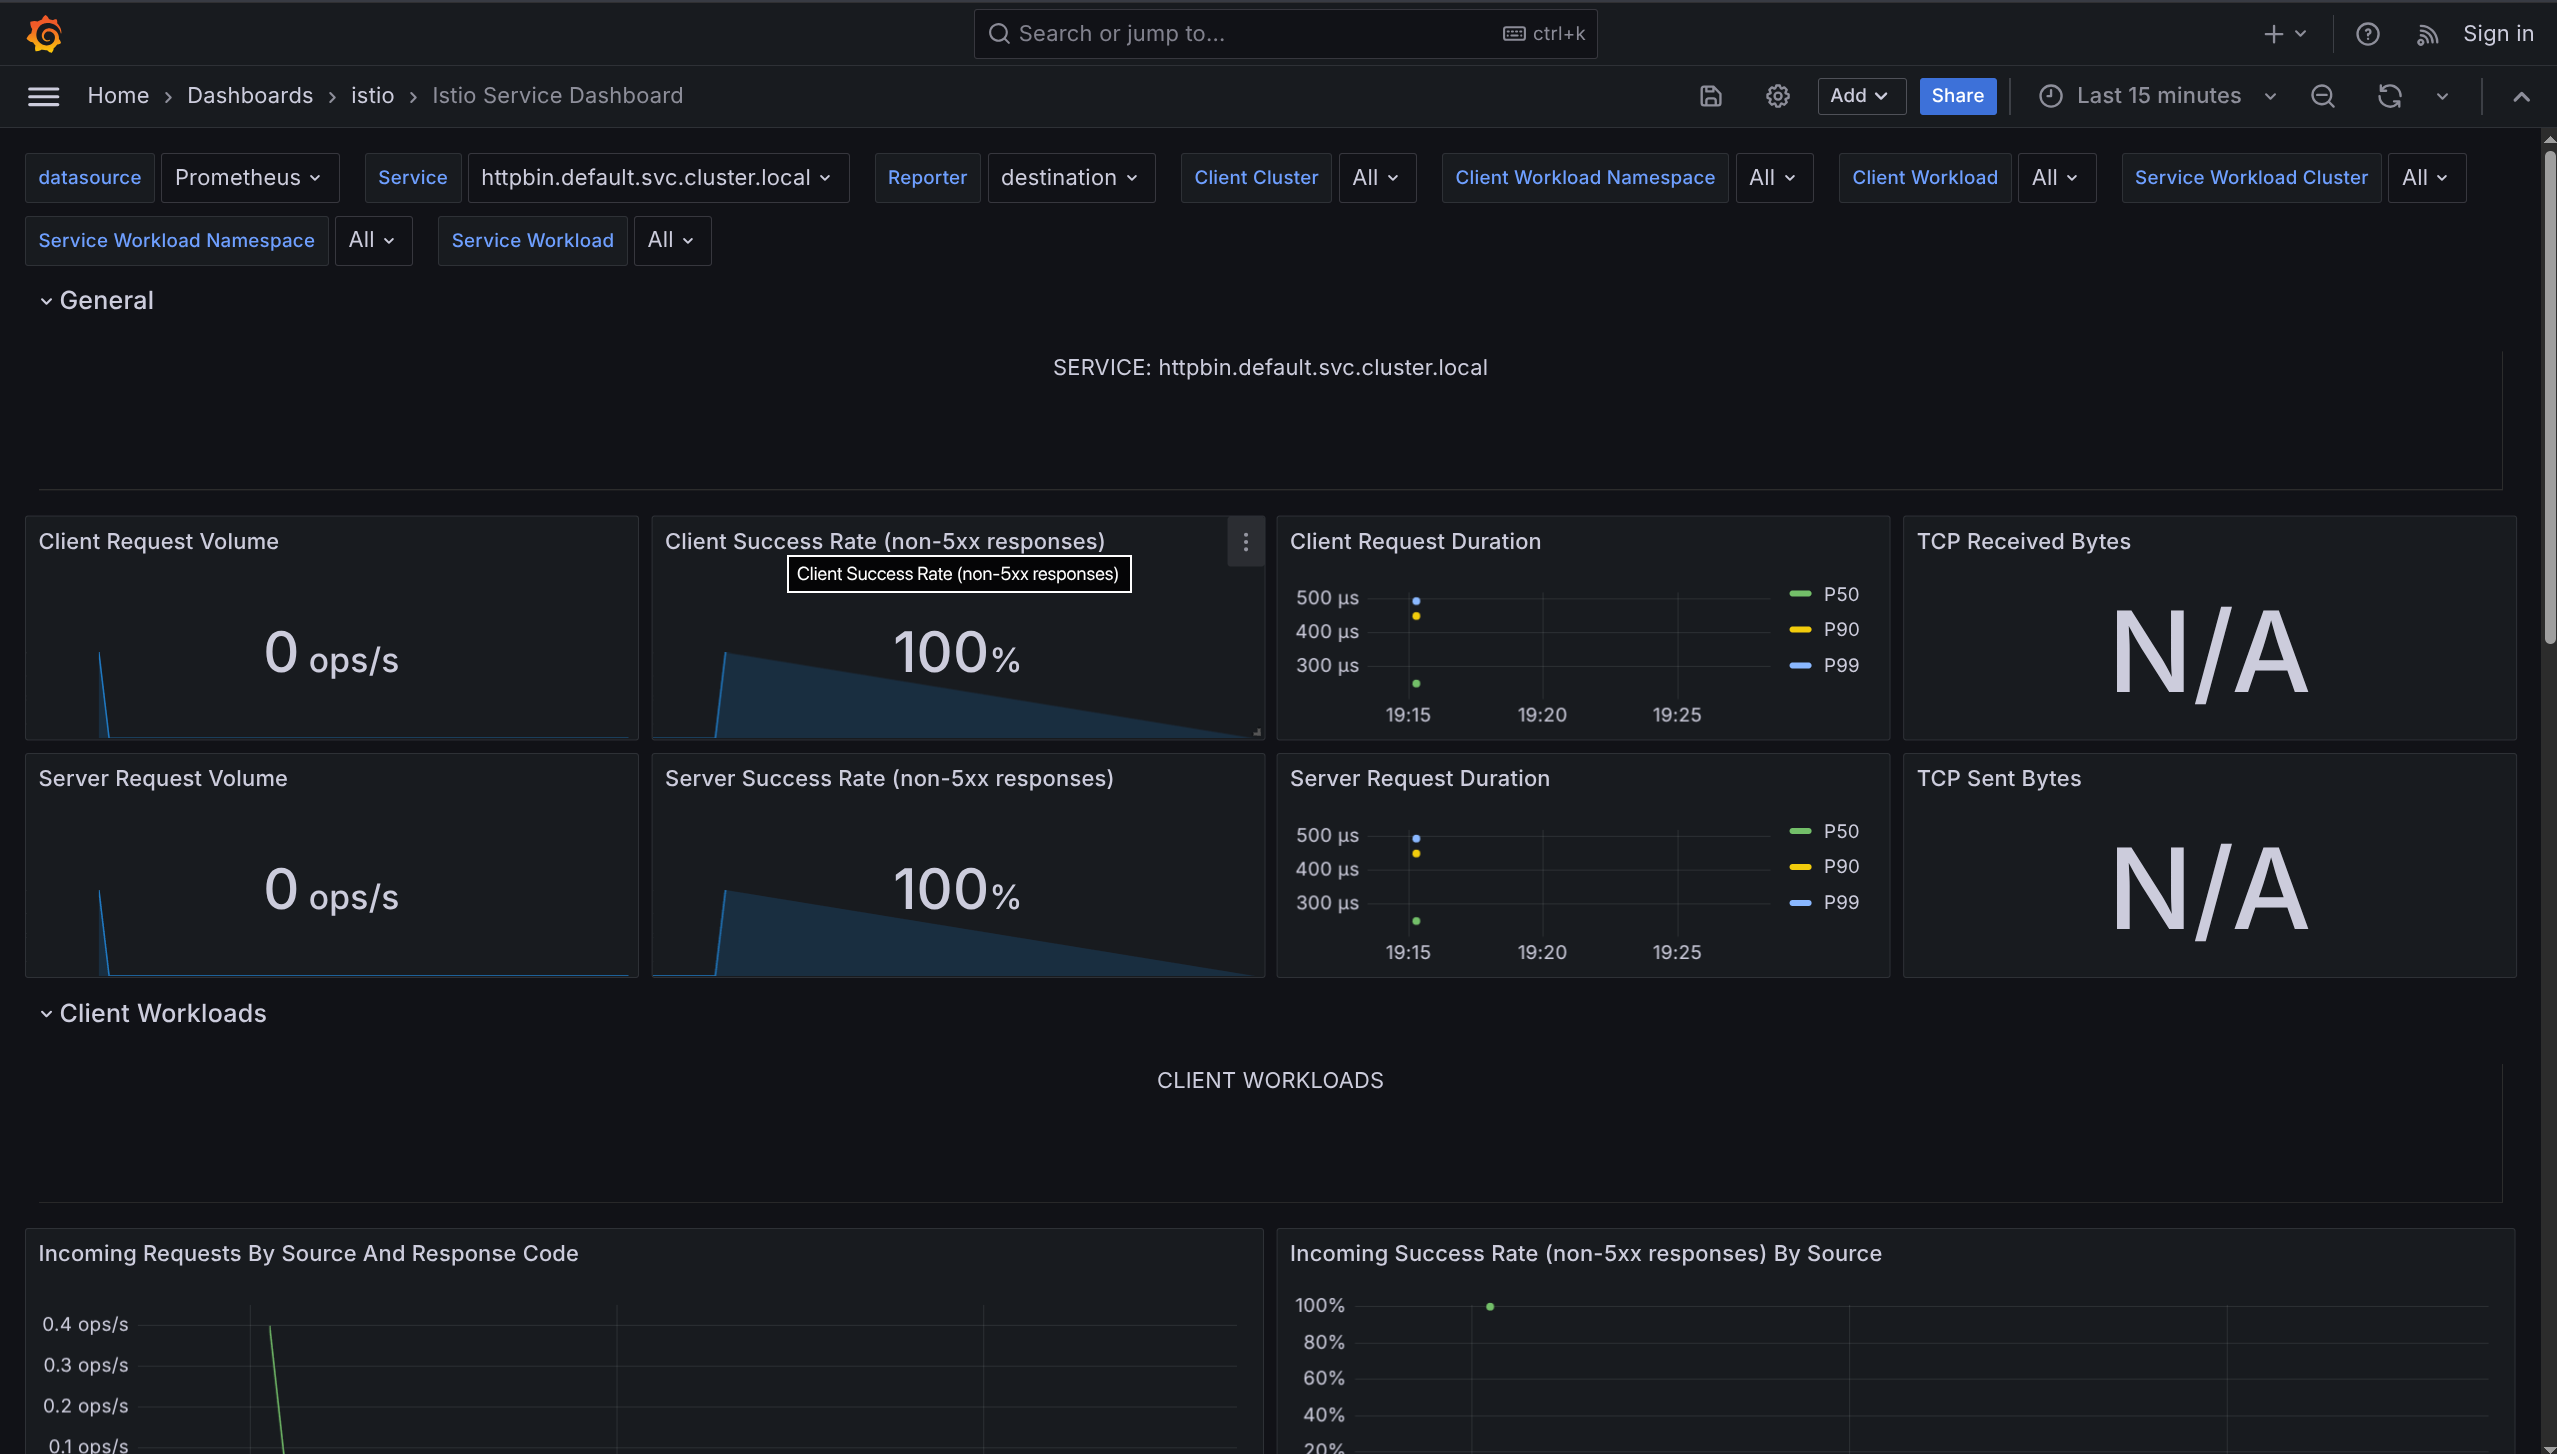
4. Istio Service Dashboard
What it shows: Details about ONE specific service
Monitors:
- Request volume
- Response codes (200, 404, 500, etc.)
- Request duration (latency)
- Traffic sources (who's calling this service)
Use when: Debugging specific service issues
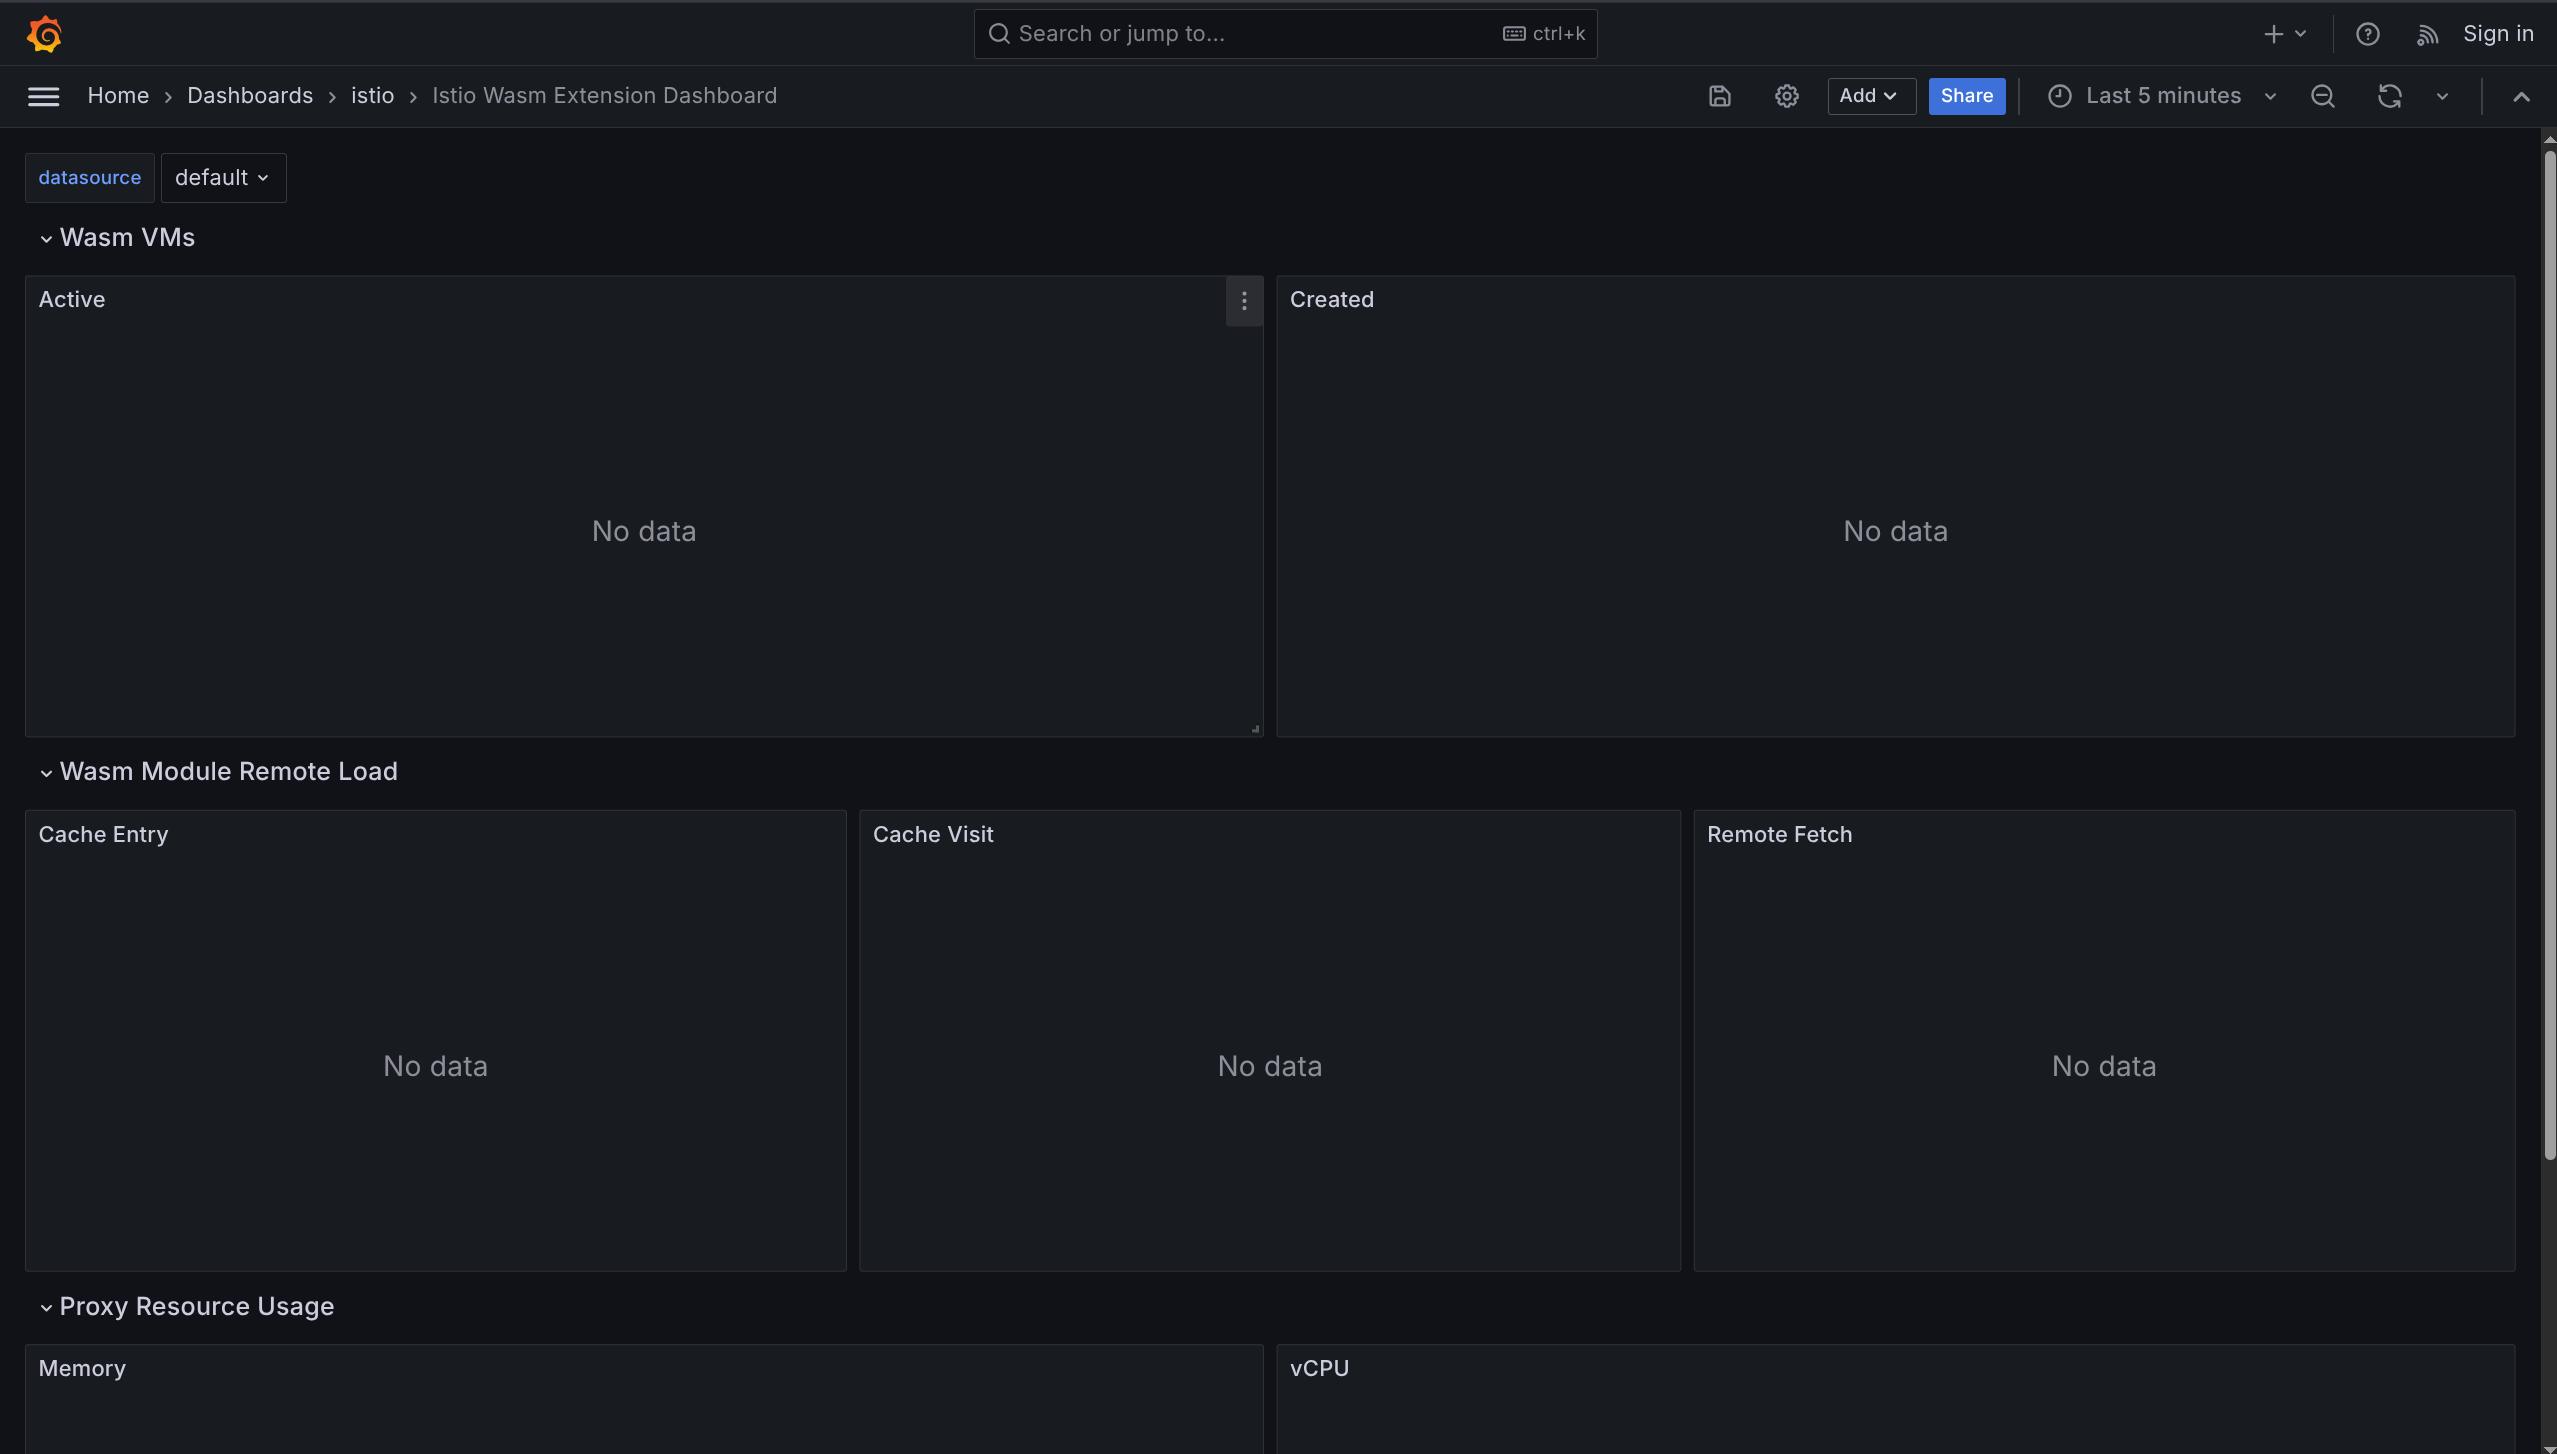
5. Istio Wasm Extension Dashboard
What it shows: WebAssembly extensions metrics
Monitors:
- Active Wasm VMs
- Created Wasm VMs
- Remote module fetching
- Proxy resource usage
Use when: Using Wasm plugins in Istio
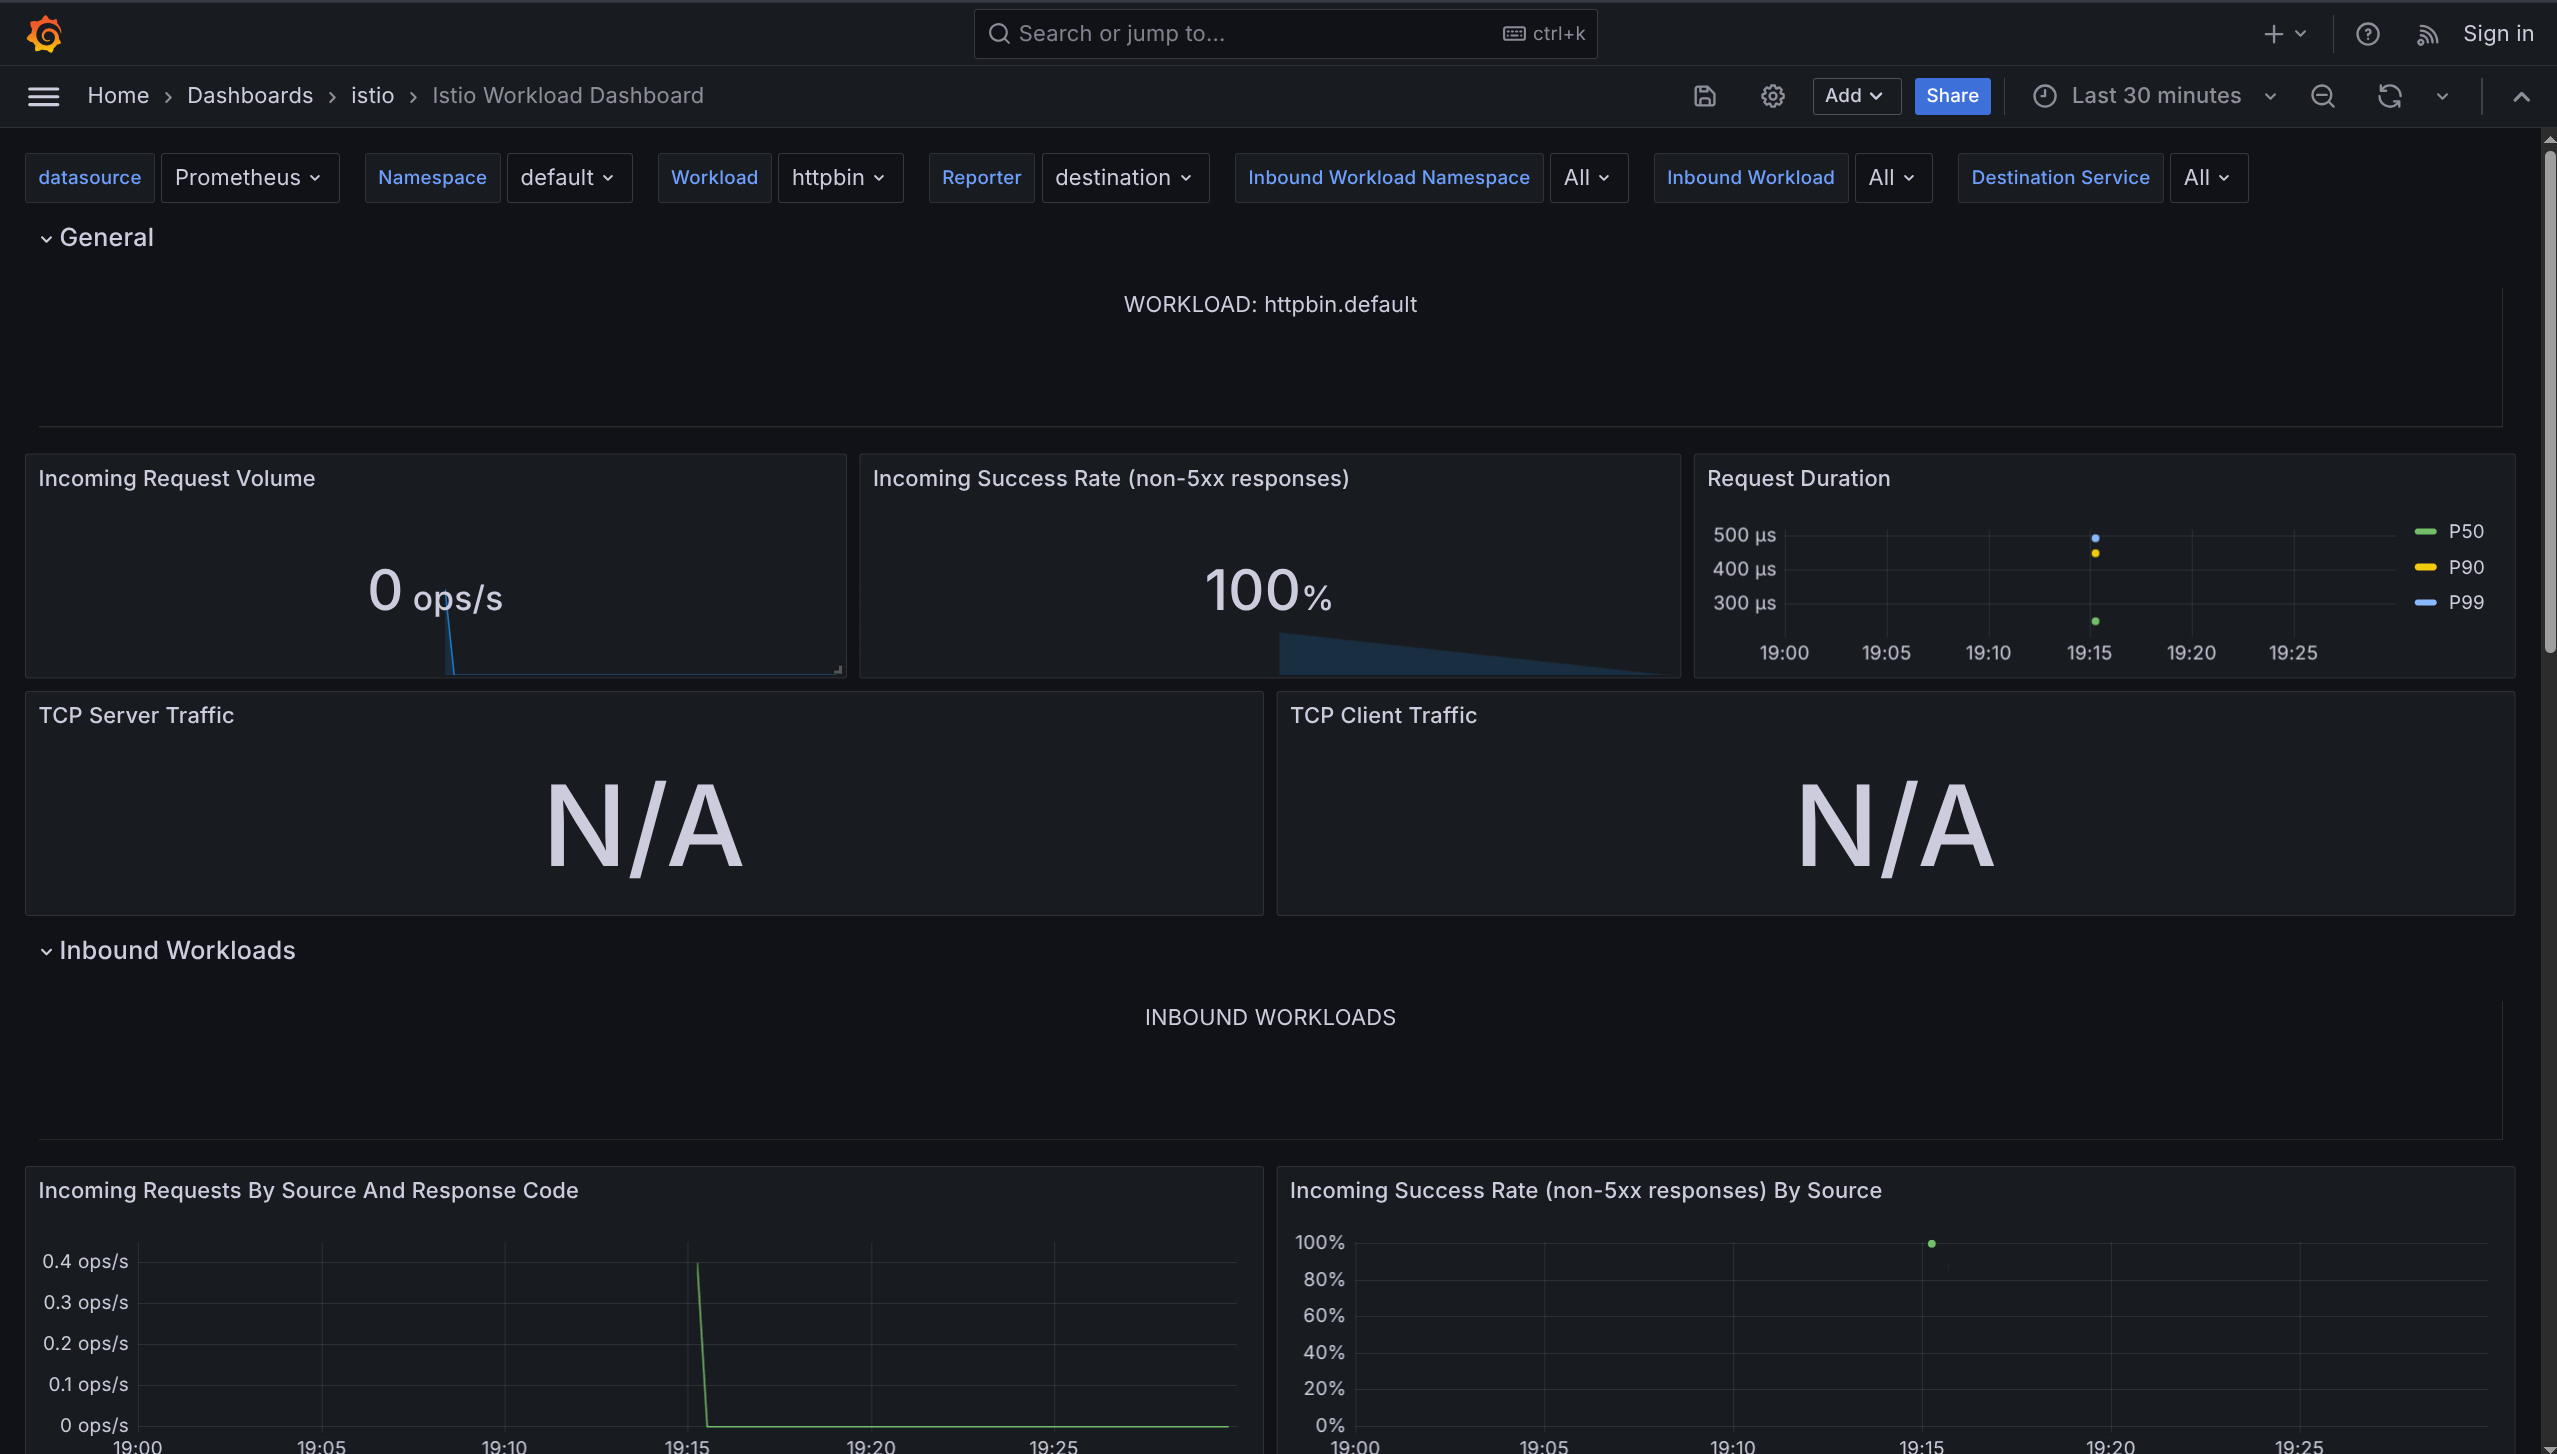
6. Istio Workload Dashboard
What it shows: Metrics for individual workloads (pods)
Monitors:
- Resource consumption per workload
- Traffic flow per workload
Use when: Checking specific pod performance
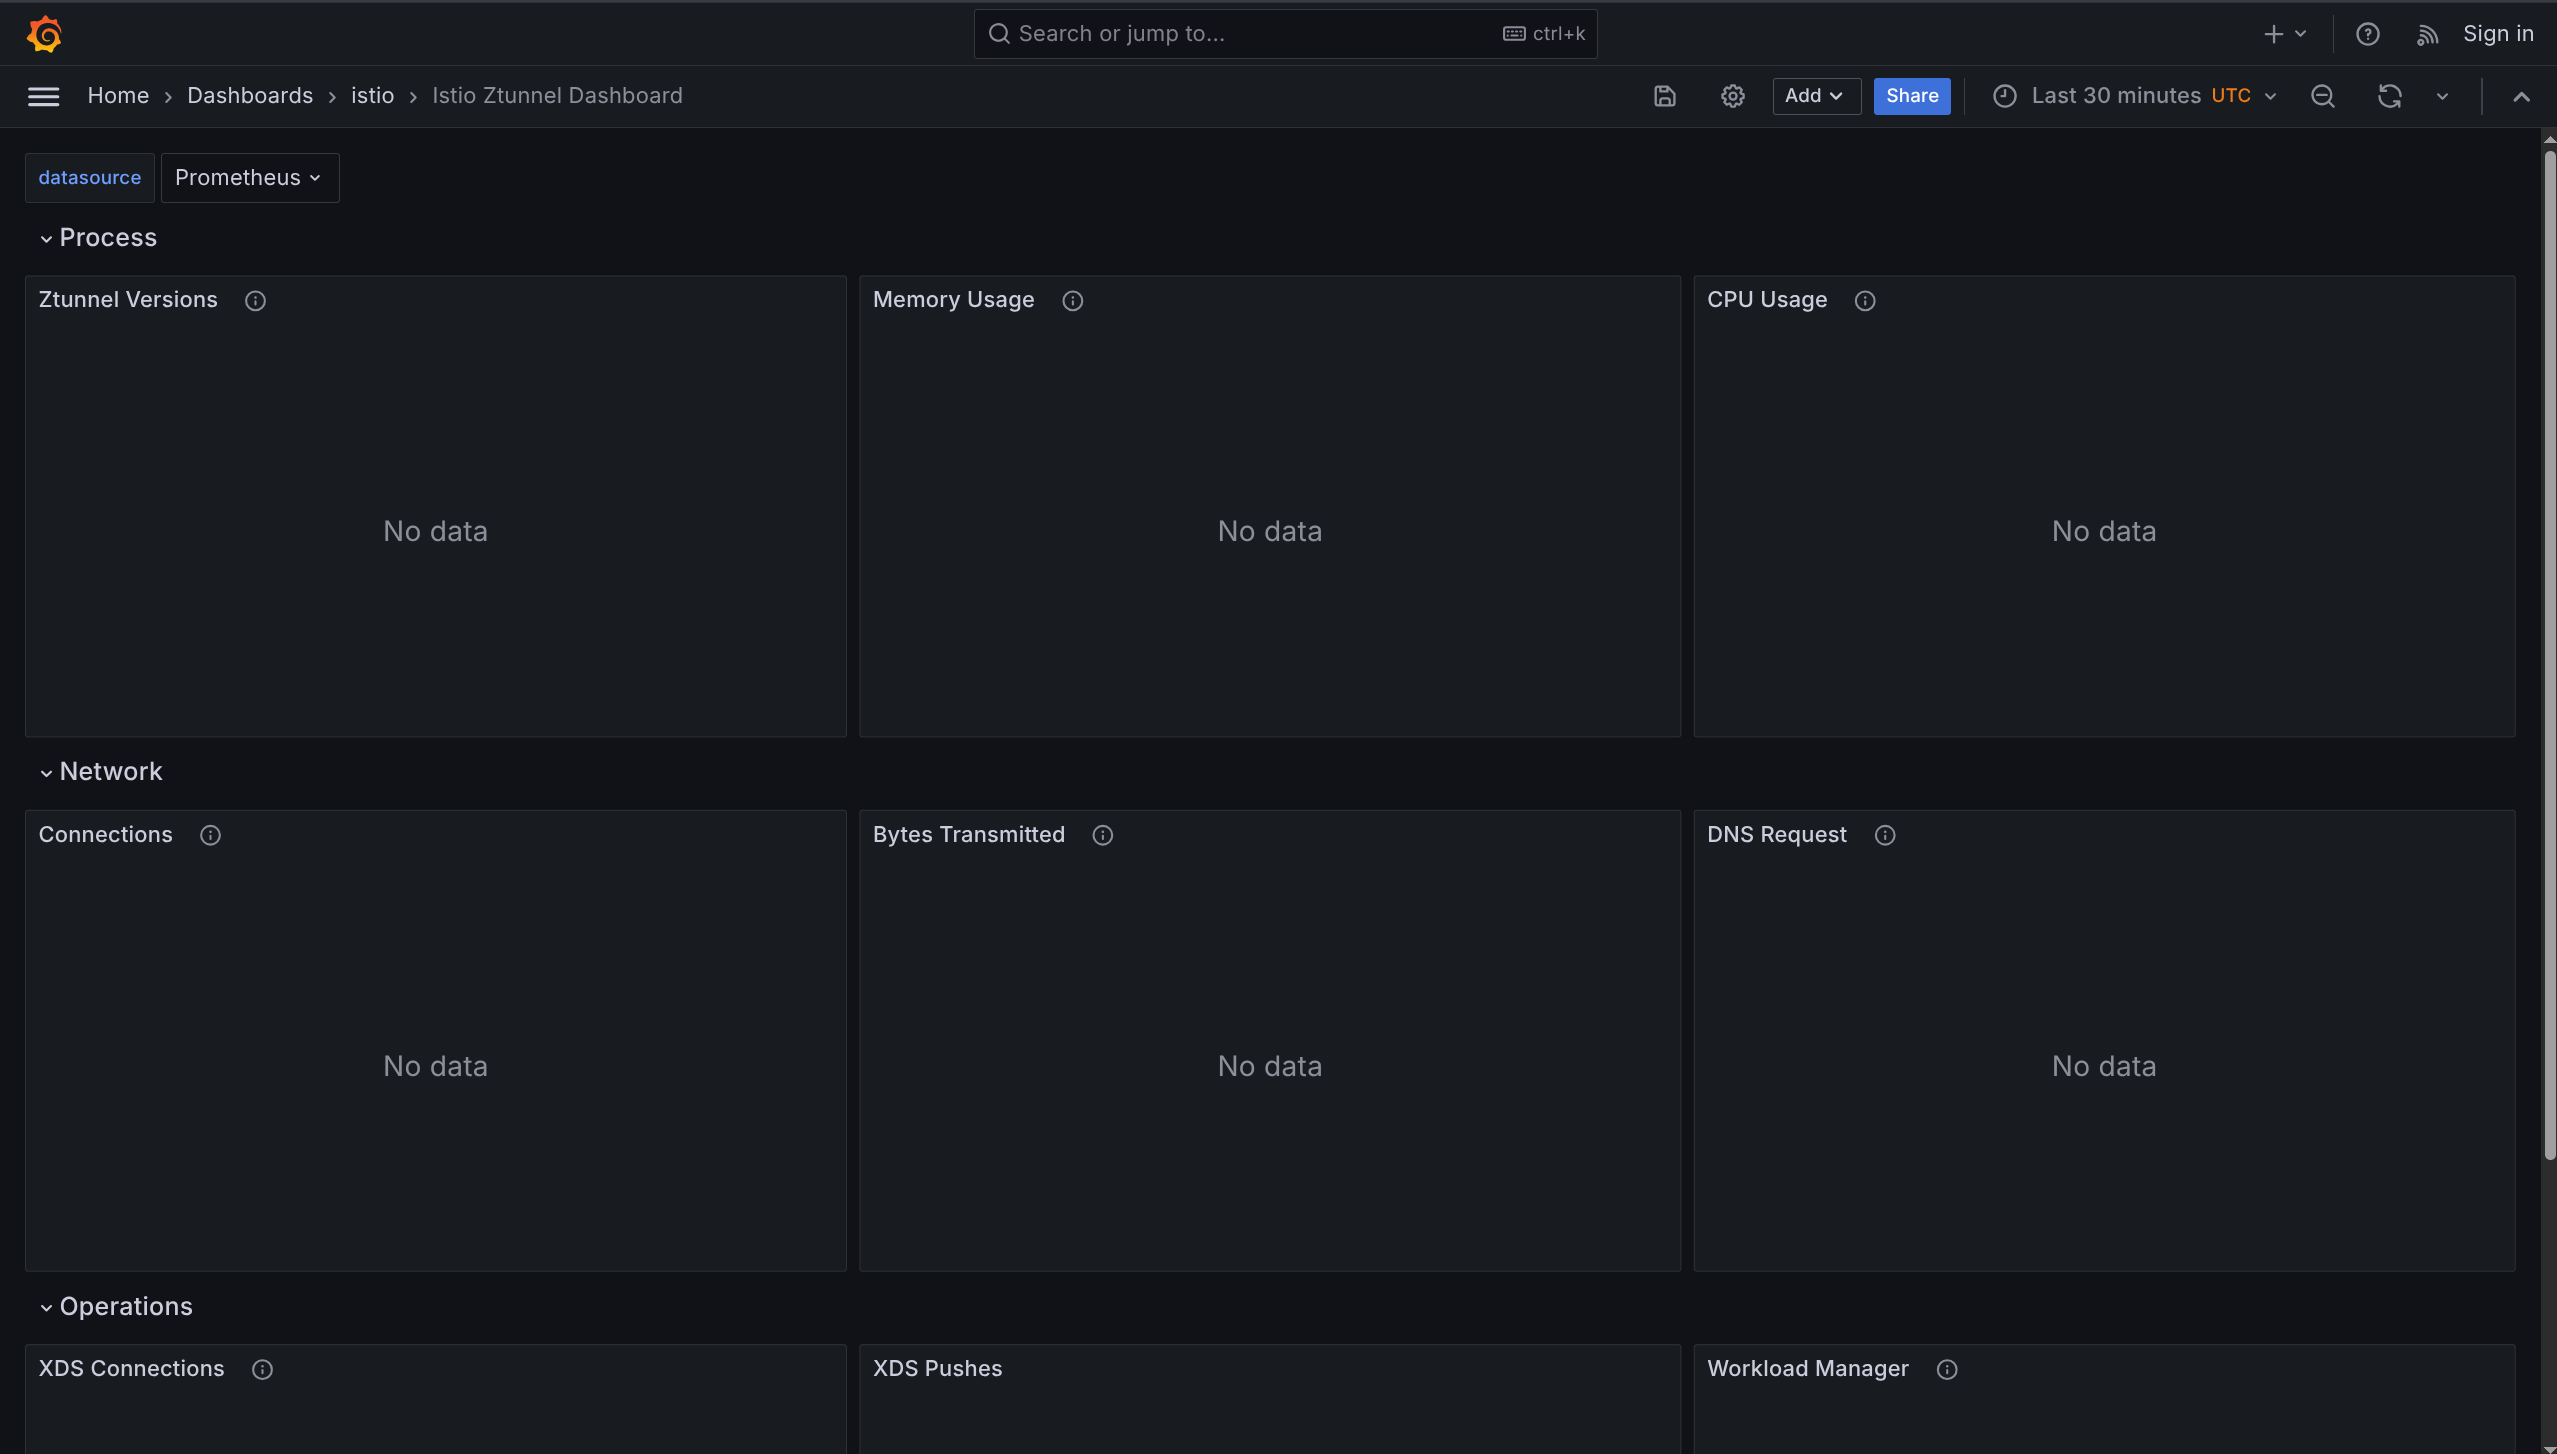
7. Istio Ztunnel Dashboard
What it shows: Ambient mode L4 proxy metrics
Monitors:
- ztunnel traffic interception
- L4 encryption metrics
Use when: Running Istio in ambient mode
Dashboard Comparison
| Dashboard | Focus | When to Use |
|---|---|---|
| Control Plane | Istio itself | Is Istio healthy? |
| Mesh | All services | Overall mesh health |
| Performance | Resource usage | Is Istio using too much? |
| Service | One service | Debug specific service |
| Wasm | Wasm plugins | Using Wasm extensions |
| Workload | Individual pods | Check pod performance |
| Ztunnel | Ambient mode | Using ambient mode |
Grafana = Pretty graphs for Prometheus data
Needs Prometheus = Must install Prometheus first
7 dashboards = Pre-configured for different monitoring needs
- Control Plane = Monitor Istio health
- Mesh = Monitor all services
- Service = Monitor one service
- Ztunnel = Monitor ambient mode
Zipkin - Distributed Tracing
What is Distributed Tracing?
Distributed tracing tracks a single request as it travels through multiple services - like following a package through different delivery stations.
Why needed: In microservices, one user request touches many services. Tracing shows the full journey.
How Tracing Works
Request Flow
1. Request enters mesh
   ↓
2. Envoy generates unique request ID
   ↓
3. ID stored in HTTP headers
   ↓
4. Each service forwards headers to next service
   ↓
5. All pieces connected into one trace
Collection by Mode
| Mode | Collection Method | Layer |
|---|---|---|
| Sidecar | Envoy proxies collect spans automatically | L4 + L7 |
| Ambient | ztunnel (L4) + waypoint proxies (L7) | L4 and L7 |
Key Concepts
Span
One piece of the trace representing work done by one service.
Contains:
- Name
- Start time
- End time
- Tags (metadata)
- Logs
Common Tags
| Tag | Description | Example |
|---|---|---|
istio.mesh_id | Which mesh | default |
istio.canonical_service | Service name | productpage |
http.url | URL called | /api/v1/users |
http.status_code | Response code | 200, 500 |
upstream_cluster | Destination cluster | reviews.default |
Trace
Collection of all spans for one request showing the full journey.
Headers to Propagate
Your application MUST forward these headers to the next service!
x-request-id
x-b3-traceid
x-b3-spanid
x-b3-parentspanid
x-b3-sampled
x-b3-flags
b3
Why: Istio can't connect requests automatically. Headers link them together.
How: Copy headers from incoming request → Add to outgoing request
Zipkin
What is Zipkin?
Zipkin is a tool to collect, store, and visualize distributed traces.
Purpose:
- See request flow
- Find slow services
- Debug issues
- Identify bottlenecks
Install Zipkin
1. Deploy Zipkin
kubectl apply -f https://raw.githubusercontent.com/istio/istio/release-1.24/samples/addons/extras/zipkin.yaml
2. Configure Istio to Use Zipkin
cat <<EOF > ./tracing.yaml
apiVersion: install.istio.io/v1alpha1
kind: IstioOperator
spec:
  meshConfig:
    enableTracing: true
    defaultConfig:
      tracing: {}
    extensionProviders:
    - name: zipkin
      zipkin:
        service: zipkin.istio-system.svc.cluster.local
        port: 9411
EOF

istioctl install -f ./tracing.yaml --skip-confirmation
3. Enable Tracing for Mesh
cat <<EOF | kubectl apply -f -
apiVersion: telemetry.istio.io/v1
kind: Telemetry
metadata:
  name: mesh-default
  namespace: istio-system
spec:
  tracing:
  - providers:
    - name: zipkin
    randomSamplingPercentage: 100.0
EOF
100.0 = Trace every request (for learning). In production, use lower % (like 1-10%).
Testing with Bookinfo
1. Enable Sidecar Injection
kubectl label namespace default istio-injection=enabled
2. Deploy Bookinfo
kubectl apply -f https://raw.githubusercontent.com/istio/istio/release-1.24/samples/bookinfo/platform/kube/bookinfo.yaml
3. Deploy Gateway
kubectl apply -f https://raw.githubusercontent.com/istio/istio/release-1.24/samples/bookinfo/networking/bookinfo-gateway.yaml
4. Generate Traffic
# Start tunnel (Minikube)
minikube tunnel

# Send 50 requests
for i in {1..50}; do
  curl -s http://10.96.209.233/productpage > /dev/null
done
View Traces in Zipkin
Open Dashboard
istioctl dashboard zipkin
Then open browser: http://localhost:9411
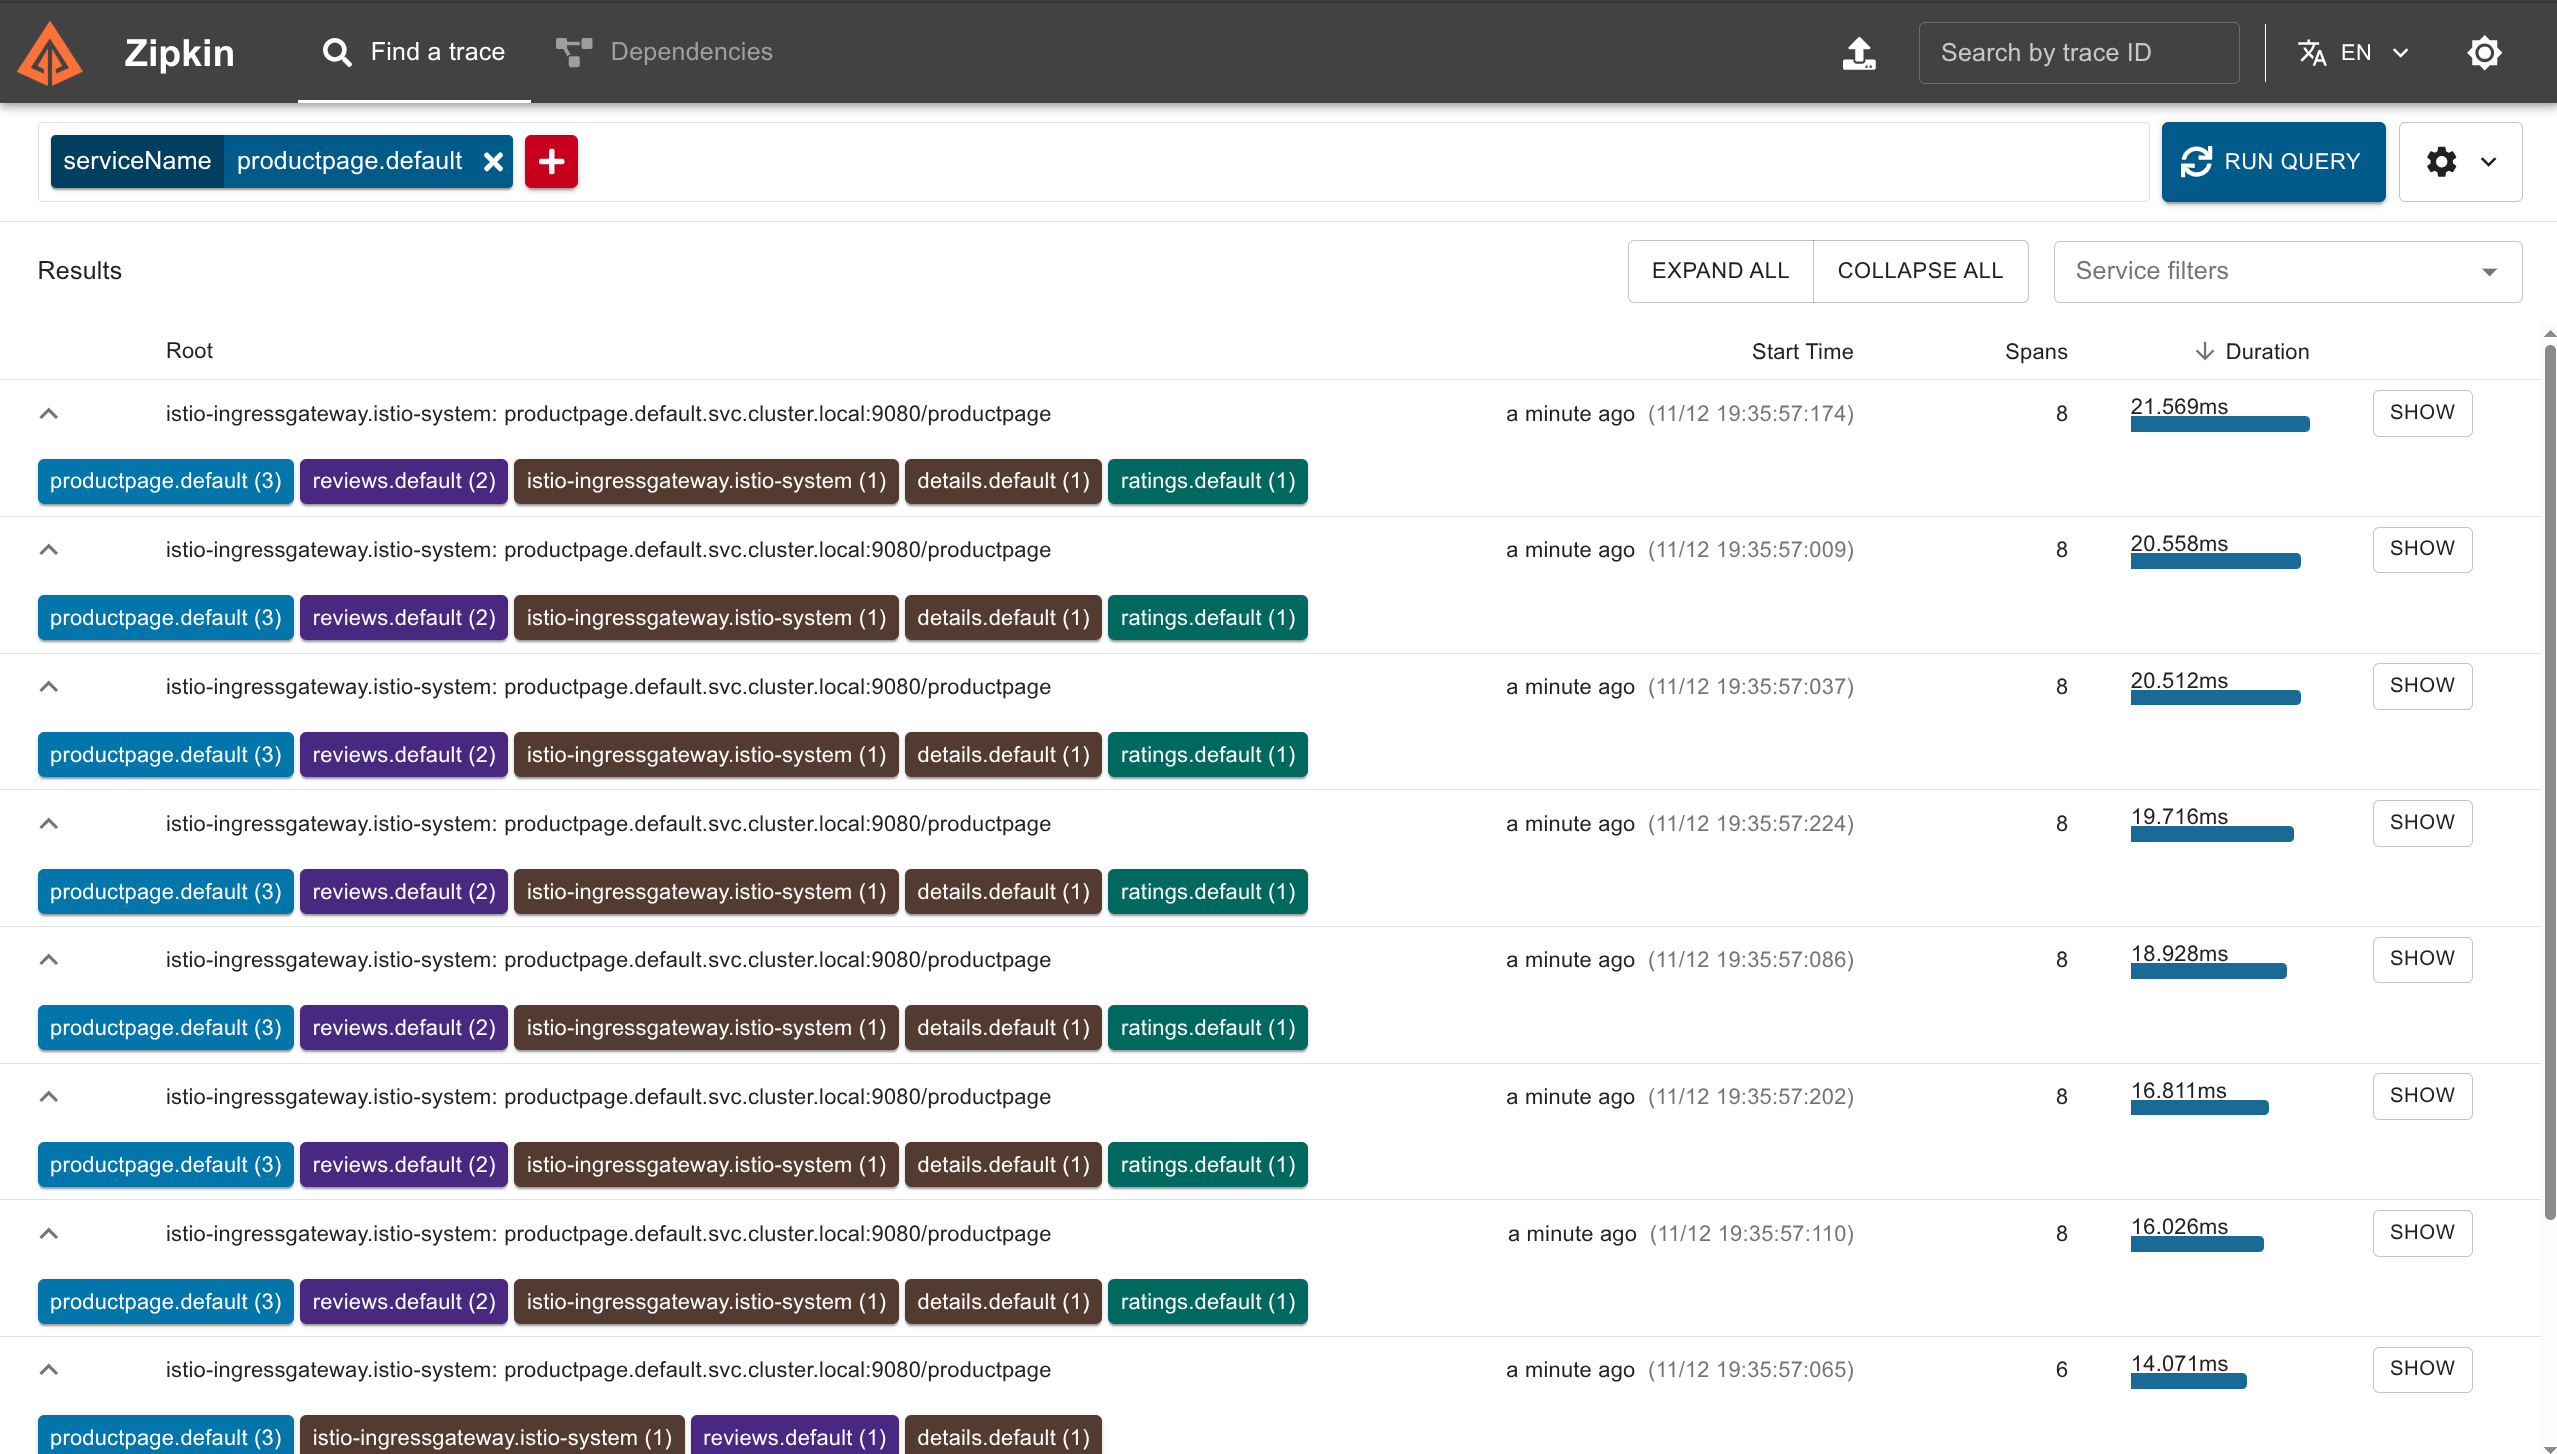
Search for Traces
- Click serviceName dropdown
- Select
productpage.default - Click Search button
What You'll See
- List of traces (one per request)
- Each trace shows all services involved
- Click trace to see details
Trace Details Show
- Duration of each service call
- HTTP method (GET, POST)
- Status code (200, 500)
- Protocol used
- Full request path through services
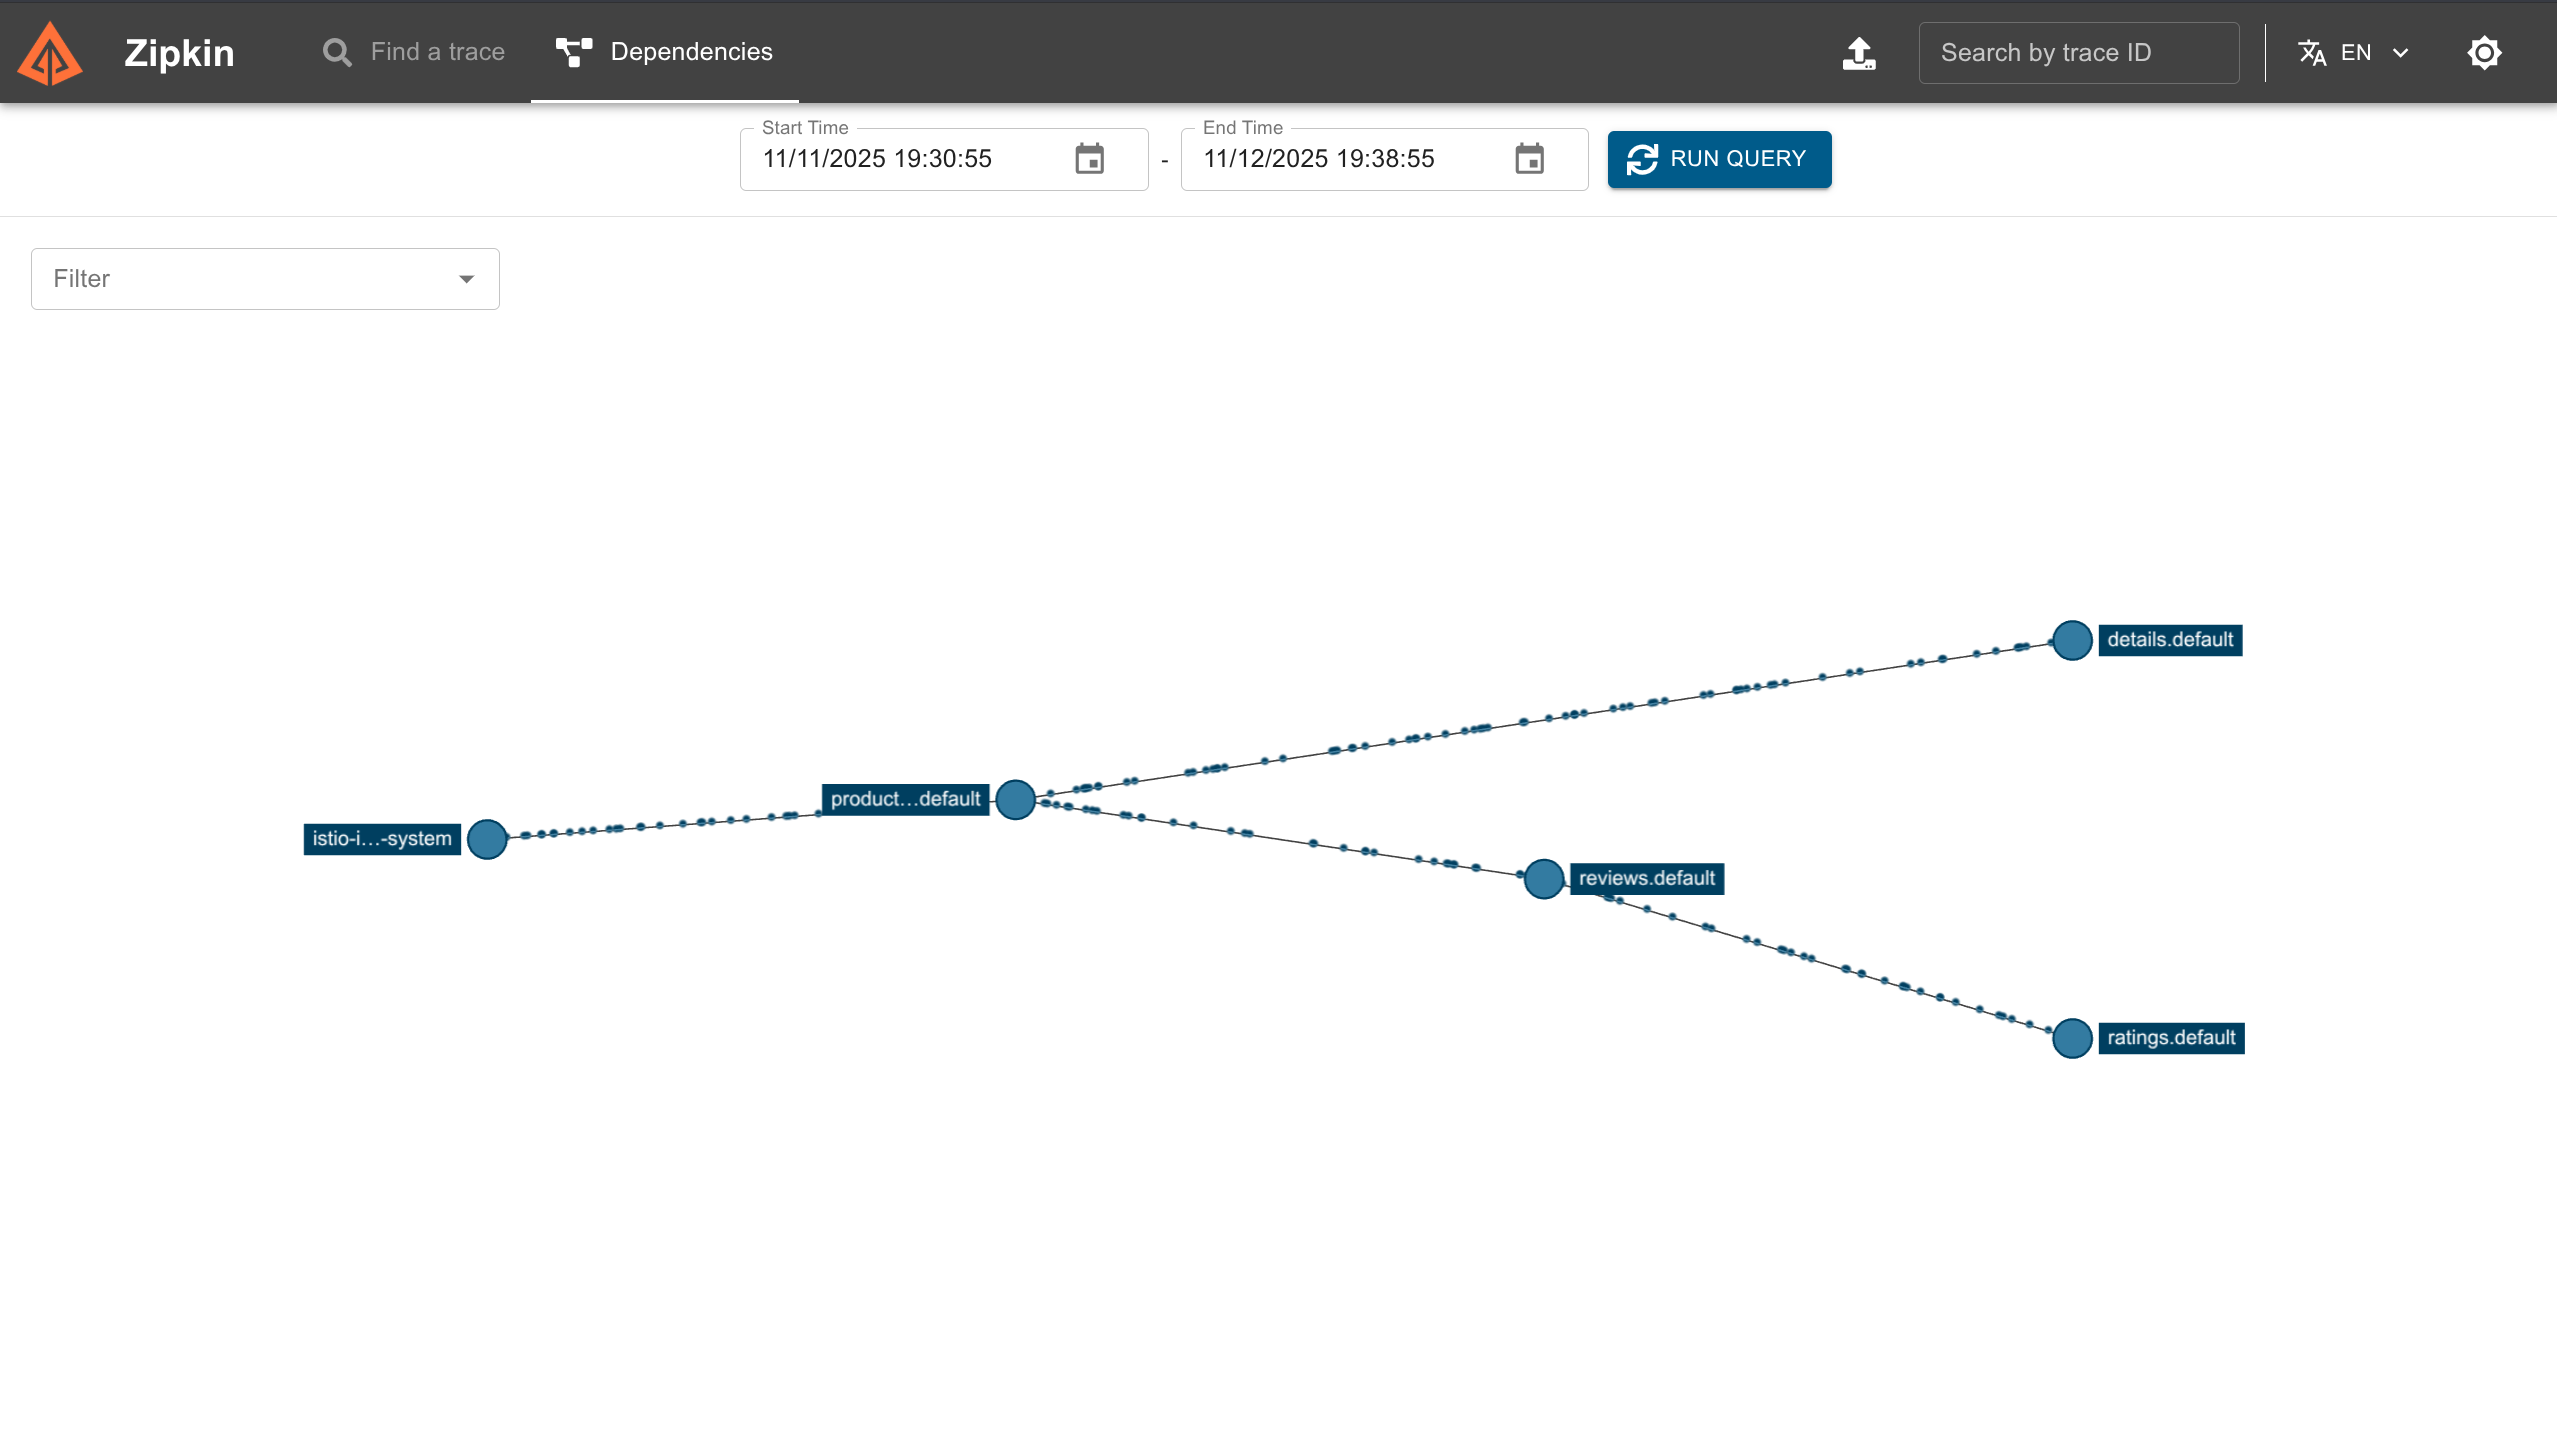
Dependencies View
What is Dependencies View?
A graph showing which services communicate with which services.
How to Access
- Click Dependencies tab in Zipkin
- Select time range
- Click Run Query
What You'll See
- Visual graph of service connections
- Arrows show request flow
- Helps find communication patterns
- Useful for debugging latency issues
Distributed Tracing = Track one request through many services
Span = One piece of work by one service
Trace = All spans together (full journey)
Headers = MUST propagate in your app code (x-b3-*, x-request-id)
Zipkin = Tool to see traces visually
Sampling = 100% for learning, 1-10% for production
Use for: Finding slow services, debugging errors, understanding request flow
Kiali
What is Kiali?
Kiali is an observability and management console for Istio - like a control center with visual graphs showing your entire service mesh.
Purpose: See, manage, and troubleshoot your service mesh in one place.
Main Features
1. Service Mesh Topology Visualization
What it does: Shows visual graph of all services and how they communicate
- Dynamic service graph (updates in real-time)
- Shows service dependencies
- Displays request traces, latency, traffic flow
- Color-coded health status
Like: Google Maps for your services
2. Health Monitoring & Traffic Observability
What it does: Shows if services are healthy or having problems
- Real-time health status
- Color-coded alerts (green = good, red = problem)
- Shows traffic anomalies
- High error rates highlighted
- Failing requests shown clearly
Uses Prometheus for metrics (traffic, success rate, latency)
3. Istio Configuration Management
What it does: Create and edit Istio configs from UI (no YAML needed!)
Can configure:
- Traffic routing (send 10% to v2, 90% to v1)
- Circuit breaking (stop calling broken service)
- Fault injection (test how app handles errors)
- Request timeouts
Validates configs: Tells you if something is wrong before you apply it
4. Integration with Other Tools
- Jaeger: Click to see distributed traces
- Grafana: Click to see detailed metrics dashboards
Install Kiali
kubectl apply -f https://raw.githubusercontent.com/istio/istio/release-1.24/samples/addons/kiali.yaml
Install Prometheus, Grafana, and Jaeger first for full features.
Open Kiali Dashboard
istioctl dashboard kiali
Then open browser: http://localhost:20001
Understanding the Service Graph
Graph Elements
| Element | Represents | Details |
|---|---|---|
| Nodes | Services, workloads, or apps | Clickable for details |
| Edges | Traffic between services | Arrows show direction |
| Colors | Health status | Green/Yellow/Red |
Health Status Colors
- Green = Healthy
- Yellow = Warning
- Red = Error
Metrics Displayed
- Request rates (requests per second)
- Latency (response time)
- Error rates (failure percentage)
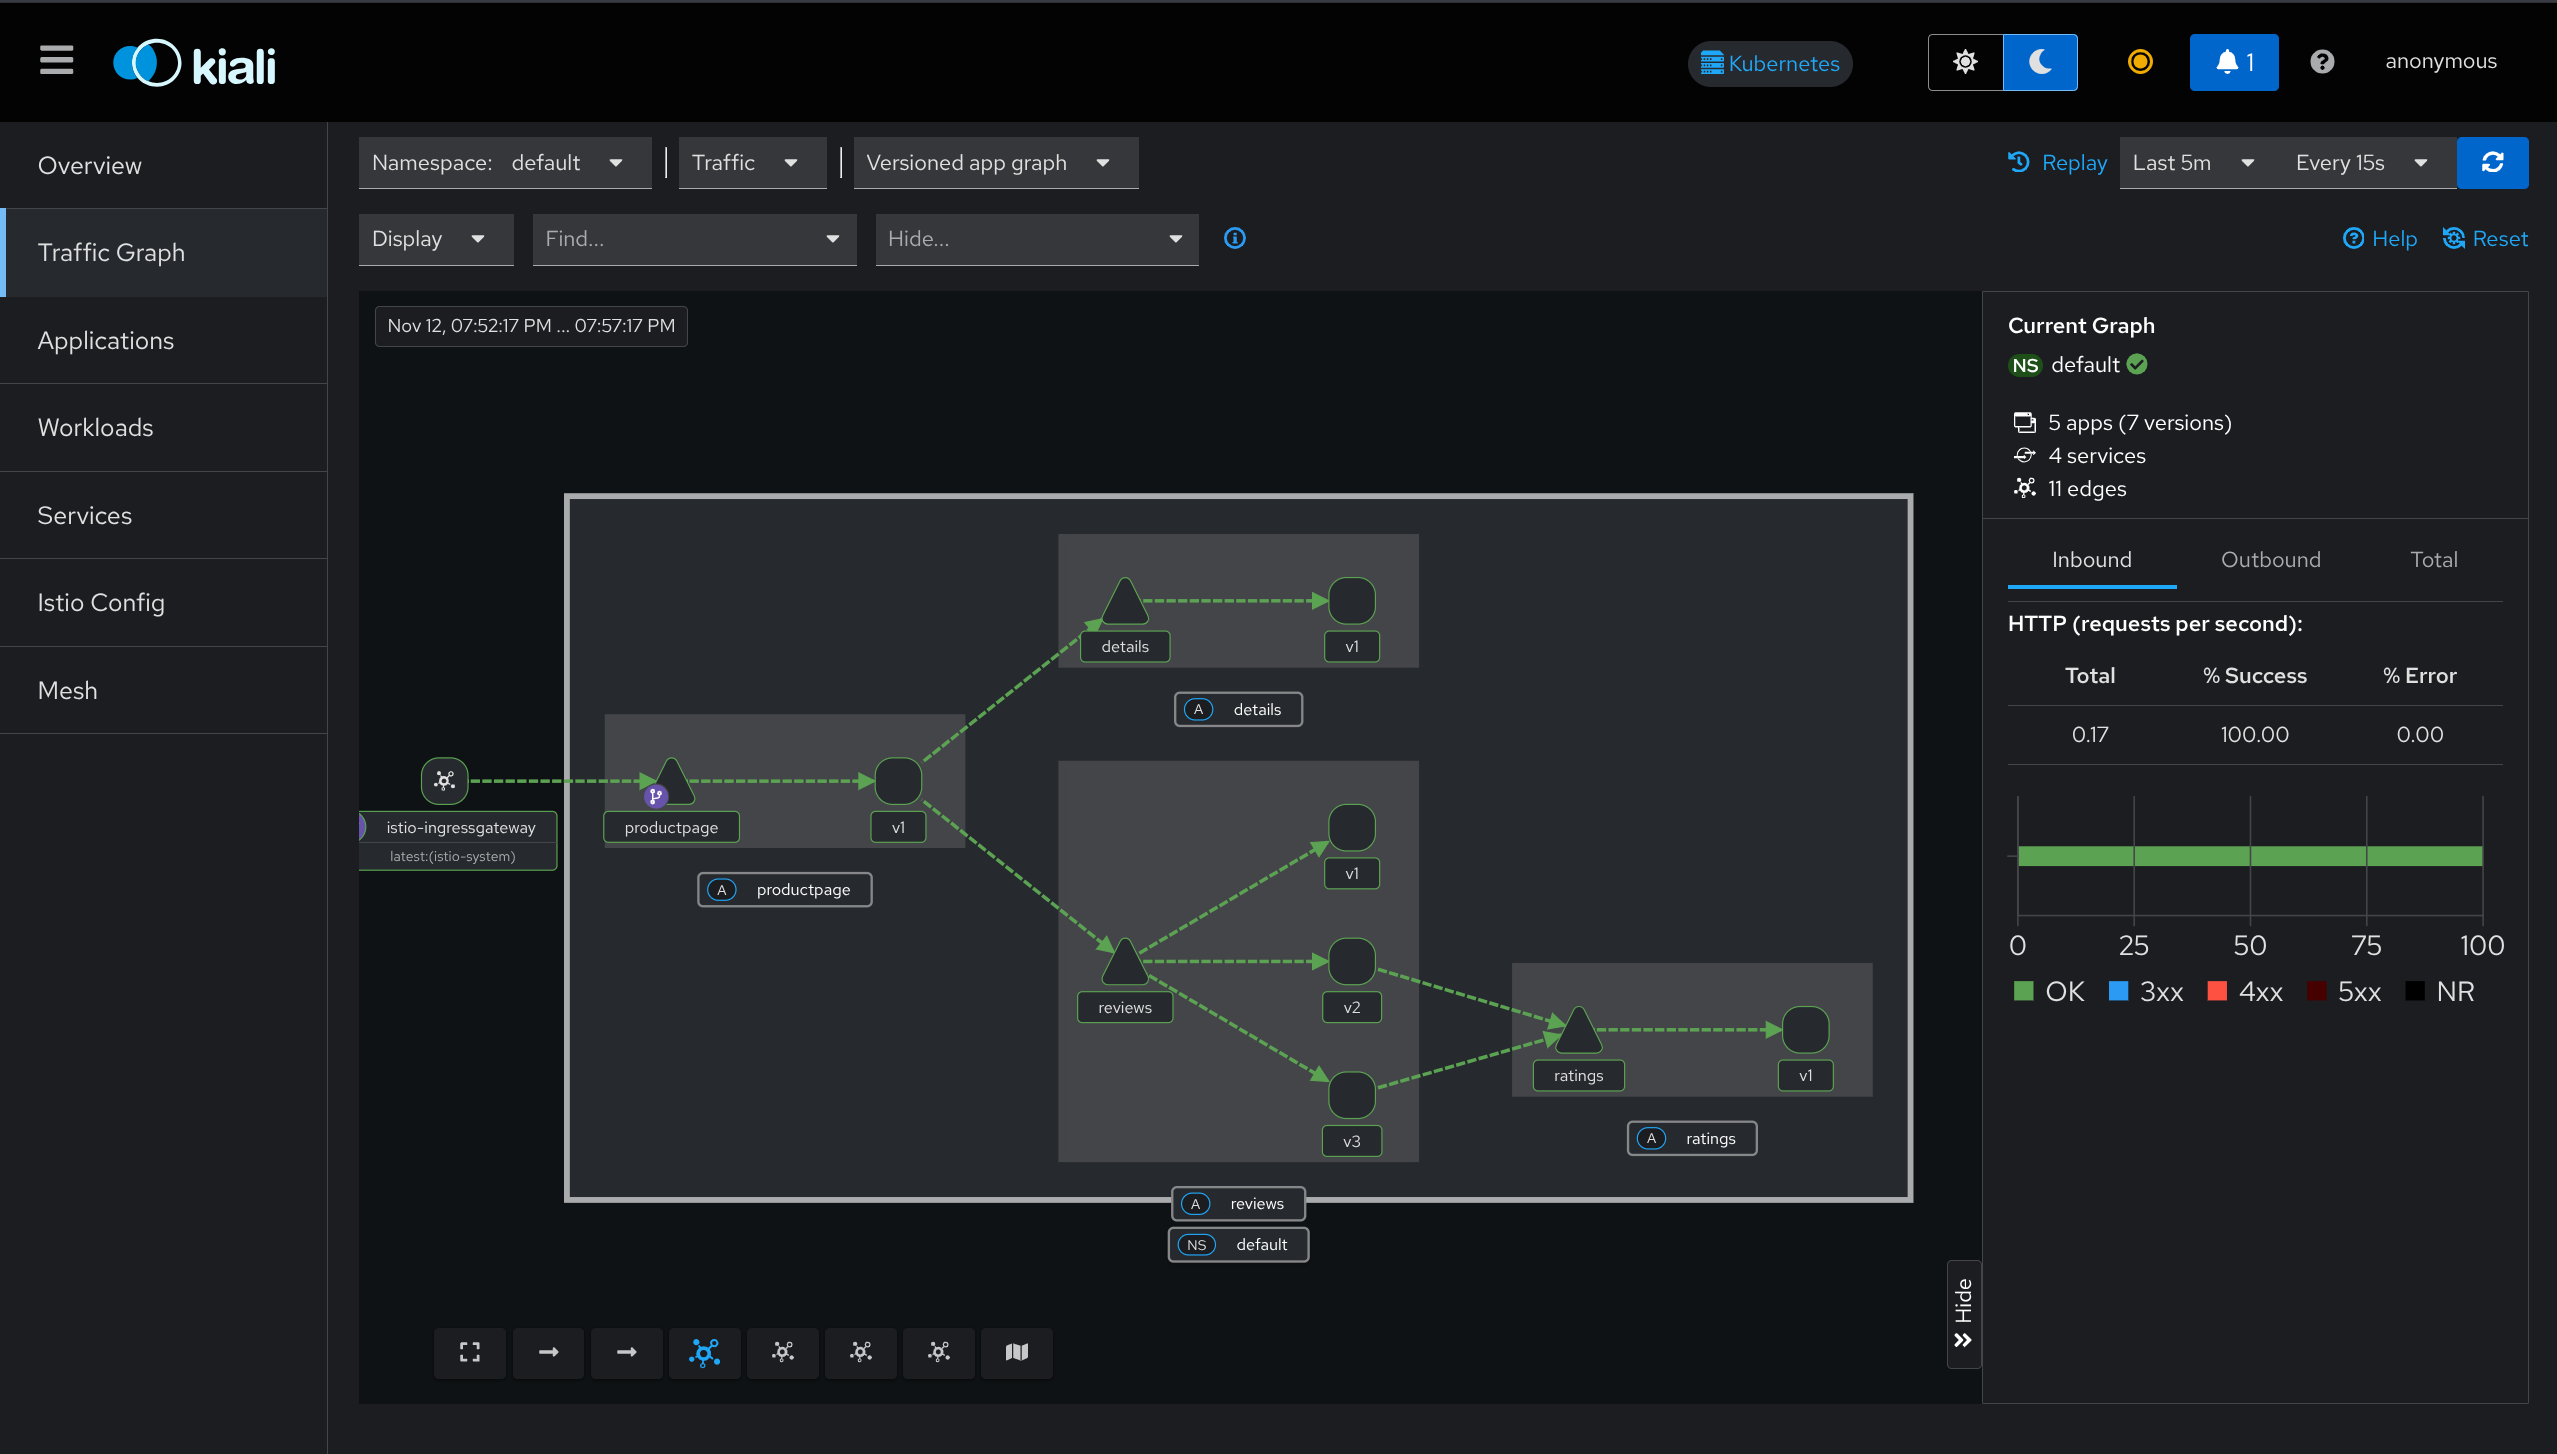
Graph Features
- Updates in real-time
- Can pause to analyze
- Can replay past traffic
- Click node to see details
- Click edge to see traffic details
Advanced Istio Configuration with Kiali
Kiali provides UI-driven Istio configuration management:
- Define traffic routing rules (canary deployments, weighted routing)
- Configure fault injection for testing resiliency
- Set up circuit breakers and request retries
- Apply mutual TLS policies and security settings
What You Can Do in Kiali
1. Traffic Routing
Set up canary deployments:
- Send 90% traffic to v1
- Send 10% traffic to v2 (testing new version)
2. Fault Injection
Test how app handles errors:
- Inject delays (make service slow)
- Inject errors (make service fail)
3. Circuit Breakers
Stop calling broken services automatically
4. Request Retries
Retry failed requests automatically
5. Security Settings
Apply mutual TLS (encrypt traffic between services)
6. Configuration Validation
Checks your Istio configs for mistakes before applying
Observability Tools Comparison
| Tool | What It Shows | Best For |
|---|---|---|
| Prometheus | Raw metrics (numbers) | Querying specific metrics |
| Grafana | Pretty graphs | Monitoring over time |
| Zipkin | Request traces | Following one request |
| Kiali | Visual service graph | Big picture + management |
Kiali = All-in-one dashboard for Istio
Visual graph = See all services and connections
Real-time = Updates as traffic flows
Management = Configure Istio from UI (no YAML!)
Integrations = Links to Jaeger (traces) and Grafana (metrics)
Color-coded = Green (good), Yellow (warning), Red (error)
Use for: Understanding mesh topology, finding problems, managing traffic routing
Istio Traffic Management
Gateways
What are Gateways?
Gateways are entry and exit points for traffic in your service mesh. They run Envoy proxy and act as load balancers at the edge of the mesh.
Purpose: Control how external traffic enters or leaves the service mesh.
Gateway Types
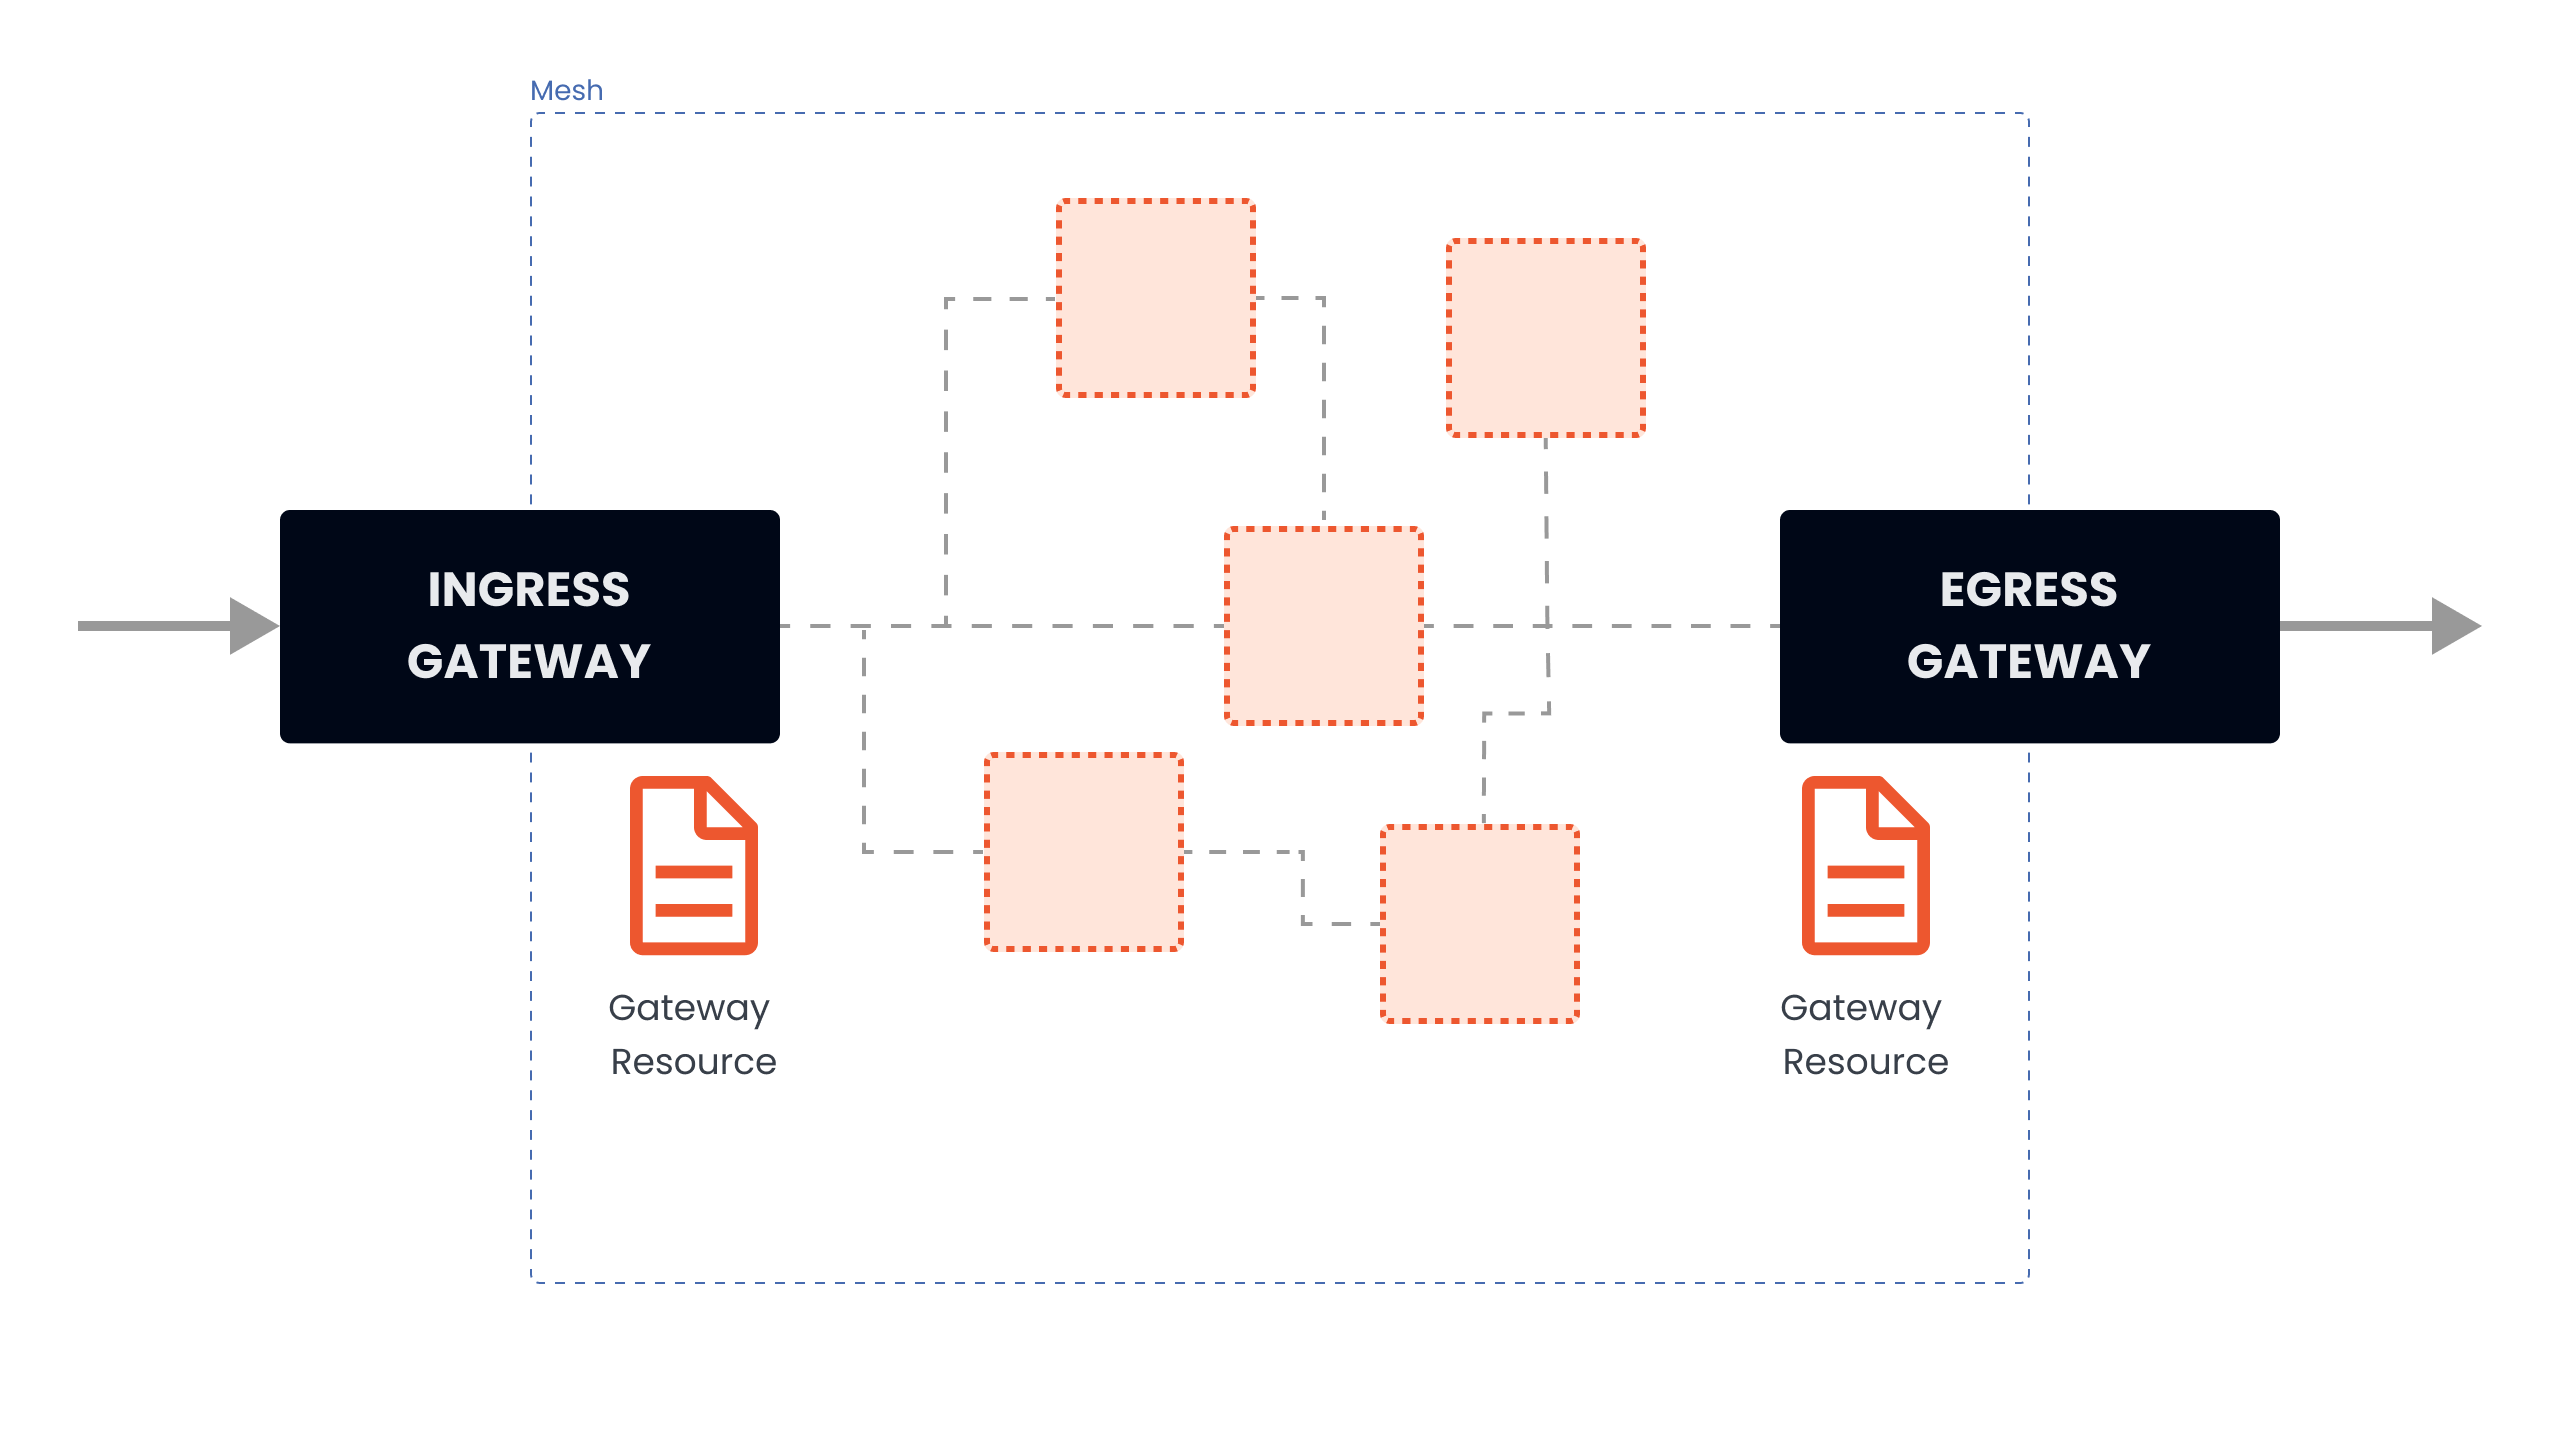
Ingress Gateway
Function: Receives traffic coming INTO the cluster from external sources
Characteristics:
- Exposes services to external clients
- Gets external IP address (LoadBalancer type)
- Handles inbound HTTP/HTTPS/TCP traffic
- Acts as entry point to the mesh
Egress Gateway
Function: Handles traffic going OUT of the cluster to external services
Characteristics:
- Controls outbound traffic from mesh
- Internal only (ClusterIP type)
- Optional component (not installed by default)
- Useful for security and monitoring
Analogy: Airport gates - ingress for arrivals, egress for departures
Deploying Gateways
Two deployment methods: istioctl profiles or Helm charts
Method 1: Using istioctl Profiles
# Default profile (ingress gateway only)
istioctl install --set profile=default

# Demo profile (both ingress + egress gateways)
istioctl install --set profile=demo
Method 2: Using Helm
# Install base
helm install istio-base istio/base -n istio-system

# Install istiod
helm install istiod istio/istiod -n istio-system --wait

# Install ingress gateway
helm install istio-ingress istio/gateway -n istio-system

# Install egress gateway
helm install istio-egress istio/gateway \
  -n istio-system \
  --set service.type=ClusterIP \
  --set labels.app=istio-egress \
  --set labels.istio=egressgateway
How Ingress Gateway Works
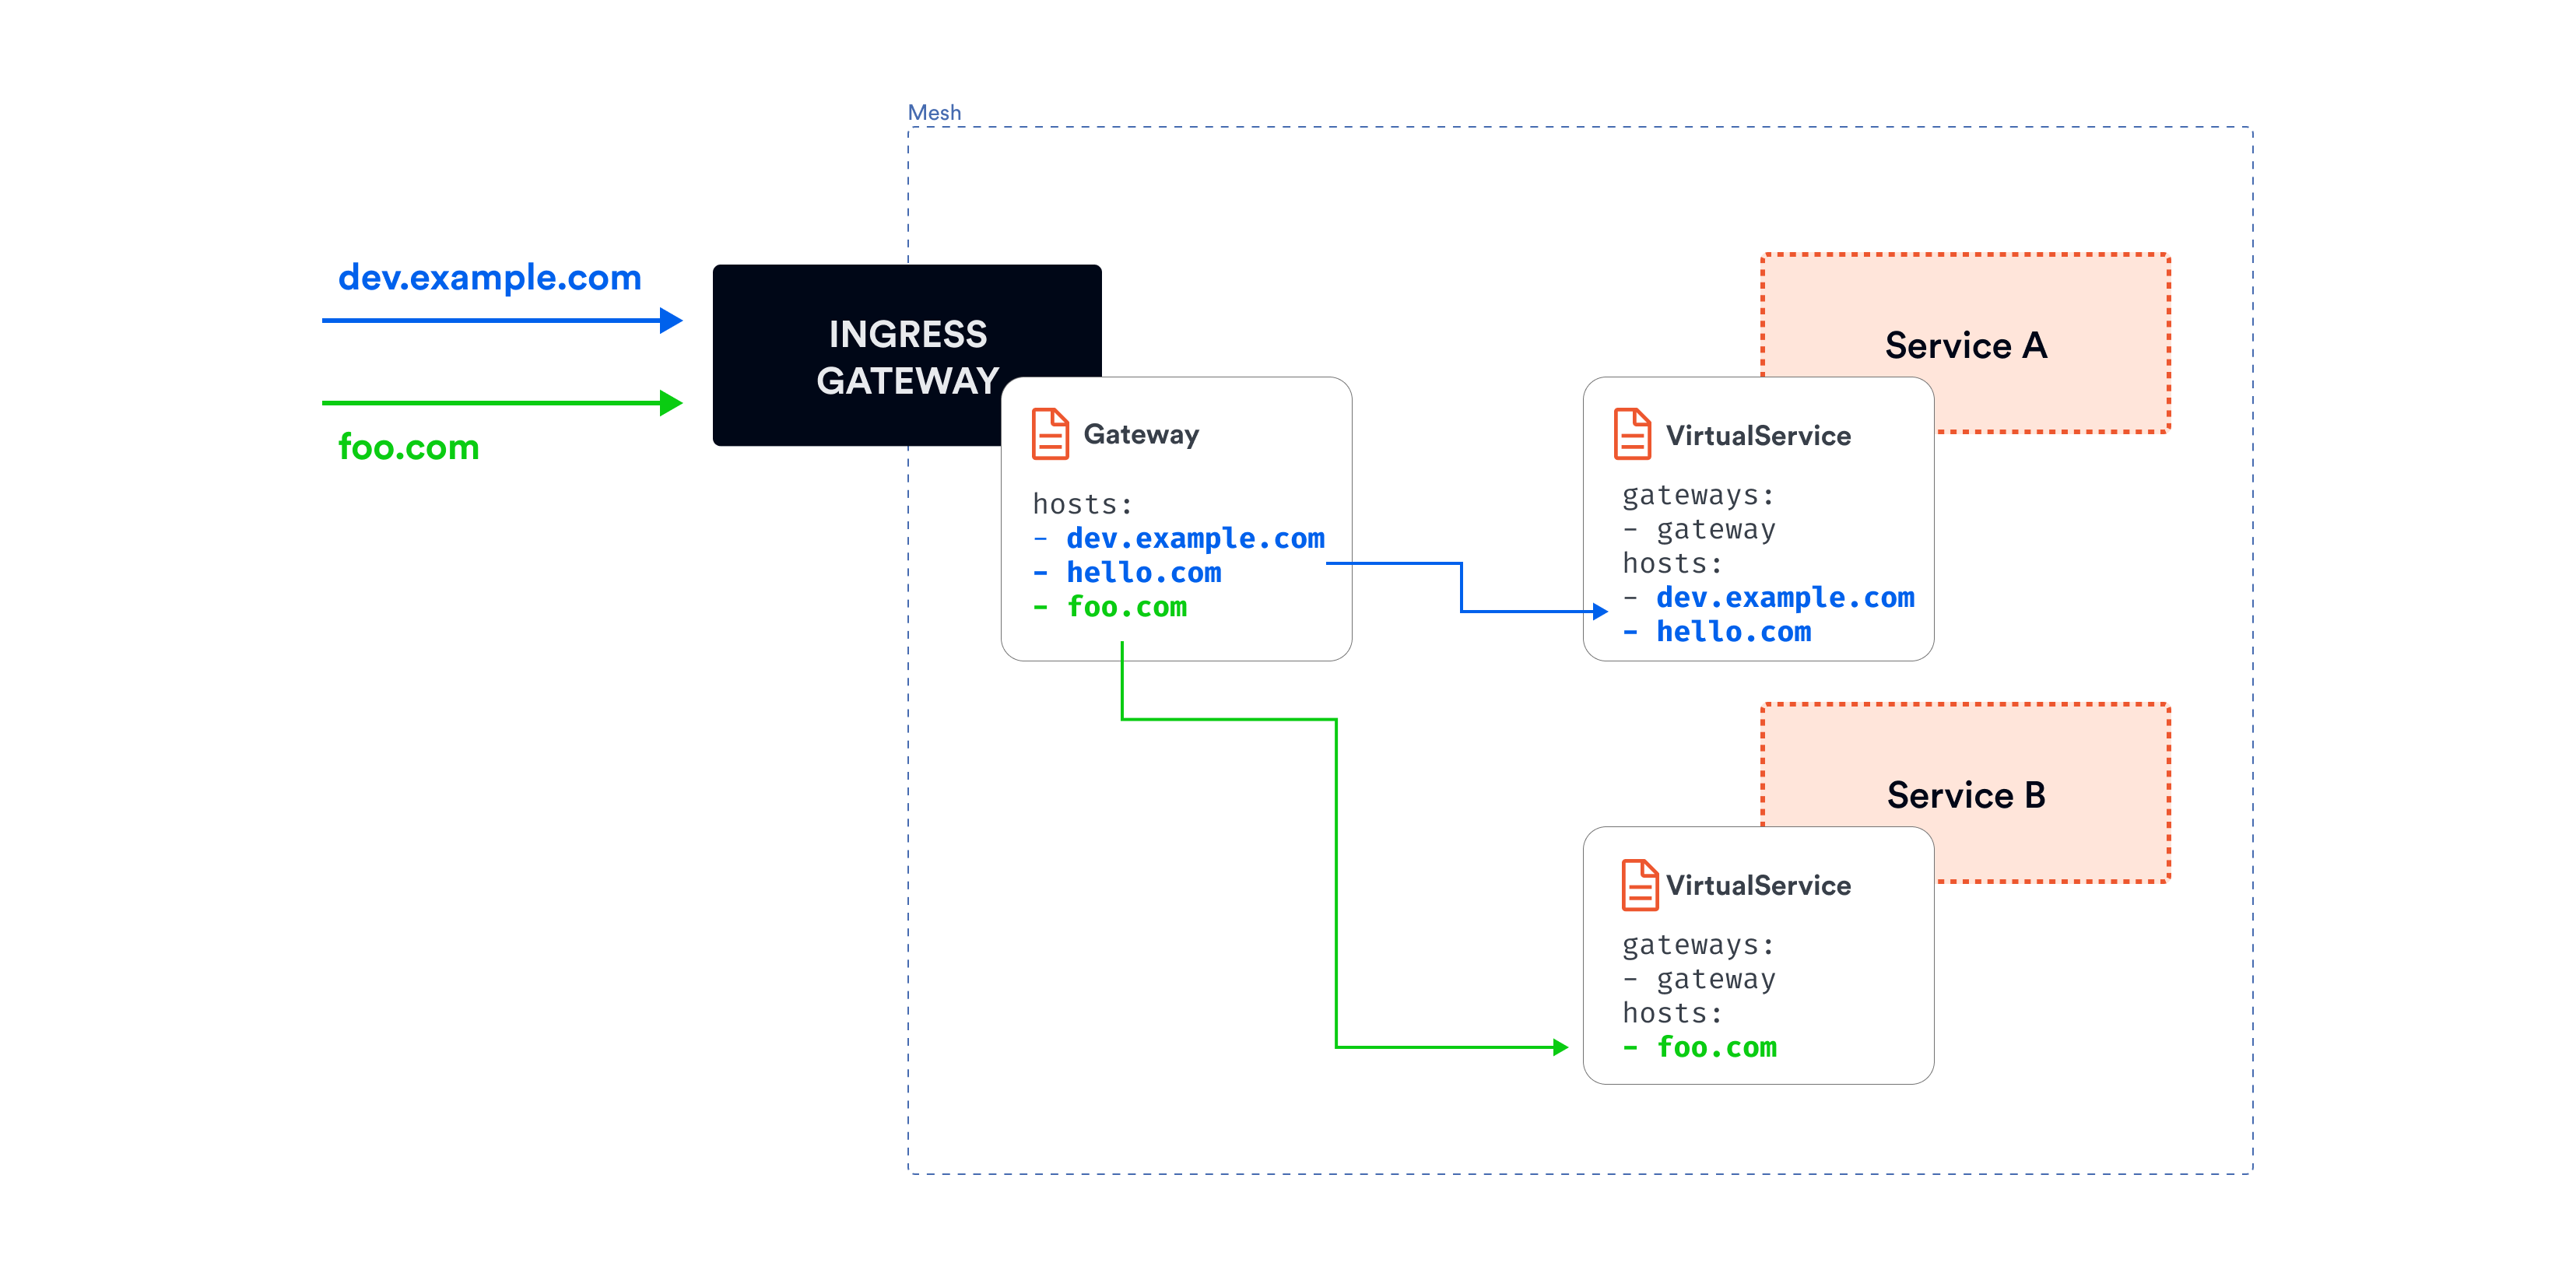
Purpose: Provides single external IP that routes traffic to different services based on hostname or path.
Traffic Flow:
---
External Client → Ingress Gateway (External IP) → VirtualService Rules → Internal Service
Example routing:
dev.example.com→ Service Atest.example.com→ Service B- All through ONE external IP address
Benefits:
- Single entry point for all external traffic
- Centralized TLS termination
- Simplified DNS management
- Unified security policies
Gateways = Entry and exit points for mesh traffic
Ingress Gateway = Handles incoming traffic (gets external IP)
Egress Gateway = Handles outgoing traffic (optional, internal only)
Two configuration approaches:
- Istio Gateway (traditional) + VirtualService
- Kubernetes Gateway API (modern) + HTTPRoute
Gateway alone = Opens the door (defines ports and protocols)
Routing rules = Direct traffic to services (VirtualService or HTTPRoute)
Use for: Exposing services externally, controlling outbound traffic, centralized traffic management
Gateway Configuration Approaches
Two configuration methods: Istio Gateway resource (traditional) or Kubernetes Gateway API (modern standard)
Approach 1: Istio Gateway Resource (Traditional)
What it does: Configures ports, protocols, and hostnames that the gateway accepts
Configuration example:
apiVersion: networking.istio.io/v1
kind: Gateway
metadata:
  name: my-gateway
  namespace: default
spec:
  selector:
    istio: ingressgateway
  servers:
  - port:
      number: 80
      name: http
      protocol: HTTP
    hosts:
    - dev.example.com
    - test.example.com
Configuration breakdown:
- selector: Targets
istio-ingressgatewaypods - port: Opens port 80 for HTTP traffic
- hosts: Accepts traffic for specified domains
- protocol: Defines traffic protocol (HTTP, HTTPS, TCP)
Important: Gateway alone only opens the door - it doesn't route traffic to services.
Requires VirtualService: Must create VirtualService to define WHERE traffic goes after entering the gateway.
Approach 2: Kubernetes Gateway API (Modern Standard)
What it is: Kubernetes-native, vendor-neutral way to configure gateways. Modern replacement for Ingress resource.
Advantages over traditional approach:
- Role-based: Different teams can manage different parts (separation of concerns)
- Extensible: Better support for advanced routing scenarios
- Portable: Works across different gateway implementations
- Standard: Kubernetes SIG-Network maintained specification
- Future-proof: Recommended for new deployments
Step 1: Install Gateway API CRDs
kubectl get crd gateways.gateway.networking.k8s.io &> /dev/null || \
  { kubectl kustomize "github.com/kubernetes-sigs/gateway-api/config/crd?ref=v1.2.1" | kubectl apply -f -; }
Step 2: Create Gateway Resource
apiVersion: gateway.networking.k8s.io/v1
kind: Gateway
metadata:
  name: my-k8s-gateway
  namespace: default
spec:
  gatewayClassName: istio
  listeners:
  - protocol: HTTP
    port: 80
    allowedRoutes:
      namespaces:
        from: Same
Configuration breakdown:
- gatewayClassName: Specifies Istio as the gateway implementation
- listeners: Defines protocol (HTTP) and port (80)
- allowedRoutes: Controls which namespaces can attach routes
- from: Same: Only routes from same namespace can attach
Step 3: Attach Routes with HTTPRoute
Purpose: Define routing rules (replaces VirtualService in Gateway API approach)
apiVersion: gateway.networking.k8s.io/v1
kind: HTTPRoute
metadata:
  name: my-route
  namespace: default
spec:
  parentRefs:
  - name: my-k8s-gateway
  rules:
  - matches:
    - path:
        type: Prefix
        value: /hello
    backendRefs:
    - name: hello-service
      port: 8080
Configuration breakdown:
- parentRefs: Attaches this route to
my-k8s-gateway - matches: Defines path matching rules (prefix
/hello) - backendRefs: Specifies target service and port
- Result: Requests to
/helloroute tohello-service:8080
Verifying Gateway Deployment
kubectl get svc -n istio-system
Expected output:
NAME                   TYPE           EXTERNAL-IP
istio-ingressgateway   LoadBalancer   XX.XXX.XXX.XXX
istio-egressgateway    ClusterIP      <none>
istiod                 ClusterIP      <none>
Service types explained:
- istio-ingressgateway: LoadBalancer type (gets external IP)
- istio-egressgateway: ClusterIP type (internal only)
- istiod: ClusterIP type (control plane, internal only)
External IP assignment:
- Cloud providers (AWS, GCP, Azure): External IP assigned automatically by cloud load balancer
- Minikube: Requires
minikube tunnelcommand to expose external IP - Kind/Docker Desktop: May require port forwarding or additional configuration
Egress Gateway Configuration
Purpose: Controls and monitors traffic leaving the mesh to external services.
Use cases:
- Centralized control: Single exit point for all outbound traffic
- Security policies: Apply consistent security rules to external calls
- Audit logging: Log all external service calls for compliance
- Access control: Restrict which external services can be accessed
- Traffic monitoring: Monitor and measure external dependencies
Configuration example:
apiVersion: networking.istio.io/v1
kind: Gateway
metadata:
  name: egress-gateway
  namespace: istio-system
spec:
  selector:
    istio: egressgateway
  servers:
  - port:
      number: 443
      name: https
      protocol: HTTPS
    hosts:
    - external-service.com
Configuration breakdown:
- selector: Targets
istio-egressgatewaypods - port: Opens port 443 for HTTPS traffic
- hosts: Only allows traffic to
external-service.com - Result: Restricts outbound traffic to specific external service
Gateway Configuration Comparison
| Feature | Istio Gateway | Kubernetes Gateway API |
|---|---|---|
| Standard | Istio-specific | Kubernetes standard |
| Routing | VirtualService | HTTPRoute |
| Flexibility | Good | Better |
| Role-based | No | Yes |
| Future | Maintained | Recommended |
| Learning curve | Moderate | Easier |
| Maturity | Stable | Growing |
- New projects: Use Kubernetes Gateway API (modern standard)
- Existing Istio setups: Continue with Istio Gateway (fully supported)
- Complex routing: Both support advanced features
- Team collaboration: Gateway API offers better role separation ::: Better | | Role-based | No | Yes | | Future | Maintained | Recommended |
Best Practices
Gateway Selection:
- Use
defaultprofile for production (ingress only) - Use
demoprofile for learning (ingress + egress) - Consider resource requirements for your environment
Security:
- Always use HTTPS in production
- Configure proper TLS certificates
- Limit egress traffic to required external services only
Monitoring:
- Monitor gateway resource usage
- Set up alerts for gateway health
- Track ingress/egress traffic patterns
Gateway = Entry/exit point for mesh traffic
Ingress = Traffic coming IN (gets external IP)
Egress = Traffic going OUT (internal only)
Two approaches: Istio Gateway (traditional) or Kubernetes Gateway API (modern)
Gateway alone = Opens the door, needs routing rules
VirtualService/HTTPRoute = Defines where to send traffic
Use for: Exposing services to internet, controlling external calls, centralizing traffic management
Simple Routing
What is Traffic Routing?
Traffic routing = Controlling where requests go based on rules and policies.
Purpose: Direct traffic to specific service versions for canary deployments, A/B testing, or gradual rollouts.
Analogy: Like a traffic cop directing cars to different roads based on destination.
Common Use Case
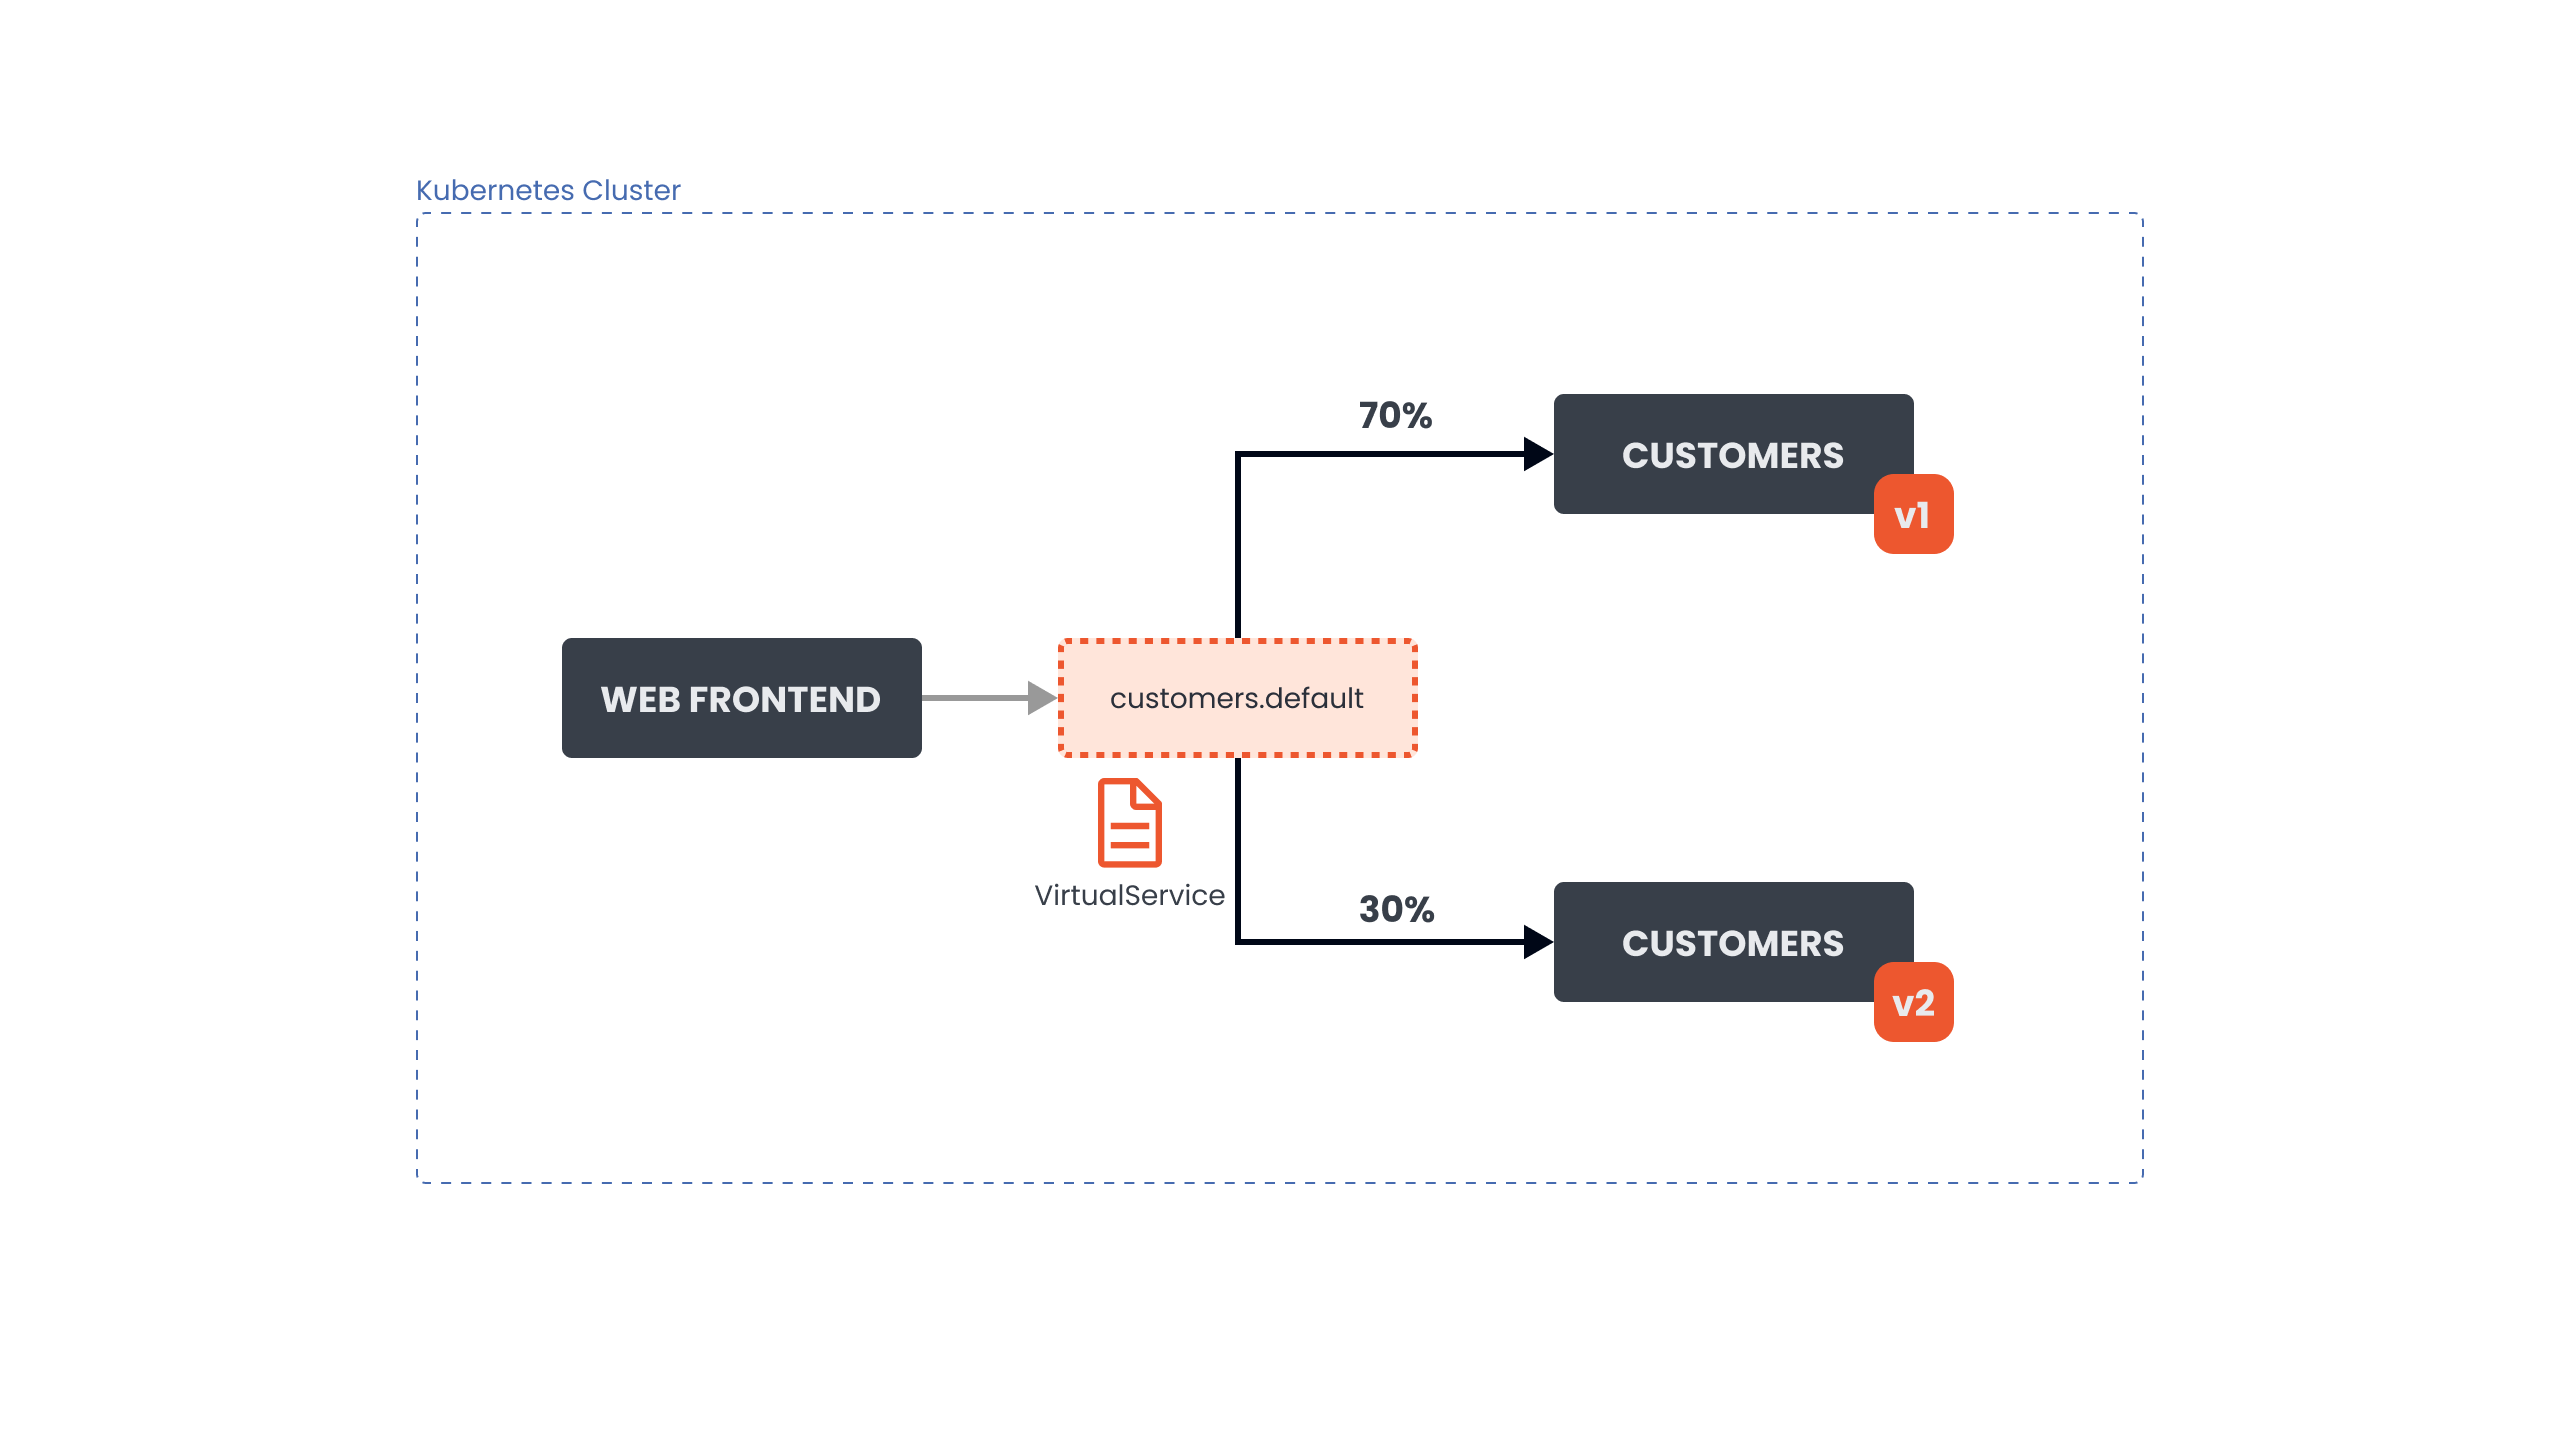
Scenario: You have 2 versions of an application deployed simultaneously:
- customers-v1 deployment (stable/old version)
- customers-v2 deployment (new version being tested)
- Goal: Split traffic between versions (e.g., 70% to v1, 30% to v2)
Why needed: Test new version with real traffic before full rollout, minimizing risk.
Traffic Routing Approaches
Two methods available: Kubernetes Gateway API (modern standard) or Istio VirtualService (traditional)
Approach 1: Using Kubernetes Gateway API (Modern Standard)
What it uses: HTTPRoute resource with weight-based traffic distribution
apiVersion: gateway.networking.k8s.io/v1
kind: HTTPRoute
metadata:
  name: customers-route
spec:
  parentRefs:
  - name: example-gateway
    namespace: default
  hostnames:
  - "customers.default.svc.cluster.local"
  rules:
  - backendRefs:
    - name: customers-v1
      port: 80
      weight: 70
    - name: customers-v2
      port: 80
      weight: 30
Configuration breakdown:
- parentRefs: Attaches route to
example-gateway - hostnames: Specifies target service hostname
- backendRefs: Defines backend services with weights
- weight: 70: Routes 70% of traffic to customers-v1
- weight: 30: Routes 30% of traffic to customers-v2
Important: Weights must sum to 100 for proper distribution
Approach 2: Using VirtualService (Istio Traditional)
What it uses: VirtualService resource with subset-based routing and weights
apiVersion: networking.istio.io/v1
kind: VirtualService
metadata:
  name: customers-route
spec:
  hosts:
  - customers.default.svc.cluster.local
  http:
  - route:
    - destination:
        host: customers.default.svc.cluster.local
        subset: v1
      weight: 70
    - destination:
        host: customers.default.svc.cluster.local
        subset: v2
      weight: 30
Configuration breakdown:
- hosts: Specifies target service
- http.route: Defines routing rules
- destination.subset: References named subset (v1 or v2)
- weight: 70: Routes 70% of traffic to v1 subset
- weight: 30: Routes 30% of traffic to v2 subset
Note: Requires DestinationRule to define subsets (covered in next section)
Understanding VirtualService Key Fields
Field: hosts
Purpose: Specifies which service this VirtualService applies to
Format options:
- Full name:
customers.default.svc.cluster.local(explicit) - Short name:
customers(within same namespace) - Wildcard:
*.example.com(matches multiple services)
Example: hosts: ["customers.default.svc.cluster.local"]
Field: http
Purpose: Defines list of HTTP routing rules
Contains: Array of route configurations with destinations and weights
Structure: Each route can have match conditions, destinations, weights, and policies
Field: destination
Purpose: Specifies where to send the traffic
Required components:
- host: Target service name (e.g.,
customers.default.svc.cluster.local) - subset: Version identifier (e.g.,
v1,v2) - requires DestinationRule - port: Optional port specification
Field: weight
Purpose: Defines percentage of traffic to route to each destination
Rules:
- Must be integer between 0-100
- Total weights across all destinations must sum to 100
- If only one destination, weight defaults to 100 (can be omitted)
Example: weight: 70 means 70% of traffic goes to this destination
Binding VirtualService to Gateway
Purpose: Expose service through gateway to make it accessible from external clients
Configuration example:
apiVersion: networking.istio.io/v1
kind: VirtualService
metadata:
  name: customers-route
spec:
  hosts:
  - customers.default.svc.cluster.local
  gateways:
  - my-gateway
  http:
  - route:
    - destination:
        host: customers.default.svc.cluster.local
        subset: v1
      weight: 70
Configuration breakdown:
- gateways: Binds VirtualService to gateway named
my-gateway - Effect: Traffic entering through
my-gatewayfollows these routing rules - Without gateways field: VirtualService only applies to mesh-internal traffic
- With gateways field: VirtualService applies to traffic from specified gateway
Host Matching Rules (Gateway + VirtualService)
Important: When VirtualService is attached to Gateway, host configuration must be compatible.
Matching logic: Gateway hosts act as a filter - VirtualService hosts must pass through this filter.
Host Matching Examples
| Gateway Hosts | VirtualService Hosts | Result | Explanation |
|---|---|---|---|
* | customers.default.svc.cluster.local | ✅ Works | Wildcard * allows all hosts |
customers.default.svc.cluster.local | customers.default.svc.cluster.local | ✅ Works | Exact match |
*.example.com | api.example.com | ✅ Works | Wildcard pattern match |
hello.default.svc.cluster.local | customers.default.svc.cluster.local | ❌ Fails | No match between hosts |
Rule: Gateway hosts define what traffic is accepted; VirtualService hosts define what traffic is routed.
Routing Methods Comparison
| Feature | HTTPRoute (Gateway API) | VirtualService (Istio) |
|---|---|---|
| Standard | Kubernetes standard | Istio-specific |
| Weight field | weight in backendRefs | weight in destination |
| Version handling | Different services | Subsets (via DestinationRule) |
| Gateway binding | parentRefs field | gateways field |
| Recommendation | Preferred for new projects | Fully supported, more features |
| Complexity | Simpler syntax | More advanced capabilities |
| Learning curve | Easier to learn | Steeper but more powerful |
| Portability | Works with any gateway | Istio-specific |
| Maturity | Growing adoption | Battle-tested |
Common Traffic Routing Use Cases
| Scenario | Weight Distribution | Purpose | Risk Level |
|---|---|---|---|
| Canary Deployment | 90% v1, 10% v2 | Test new version with minimal traffic | Low |
| Blue-Green Deployment | 100% v1 → 100% v2 | Complete instant switch | Medium |
| A/B Testing | 50% v1, 50% v2 | Compare versions with equal traffic | Medium |
| Gradual Rollout | 70% v1, 30% v2 → adjust over time | Slowly increase new version traffic | Low |
| Shadow Traffic | 100% v1 (+ mirror to v2) | Test without affecting users | Very Low |
Traffic Split Progression Example
Typical canary deployment progression:
Phase 1: 100% v1, 0% v2   (Initial state - v2 deployed but no traffic)
   ↓
Phase 2: 95% v1, 5% v2    (Initial canary - minimal exposure)
   ↓
Phase 3: 90% v1, 10% v2   (Increased canary - monitor metrics)
   ↓
Phase 4: 70% v1, 30% v2   (Significant traffic - validate performance)
   ↓
Phase 5: 50% v1, 50% v2   (Equal split - final validation)
   ↓
Phase 6: 10% v1, 90% v2   (Near completion - prepare for full rollout)
   ↓
Phase 7: 0% v1, 100% v2   (Complete migration - remove v1)
Decision points: Monitor error rates, latency, and business metrics at each phase before proceeding.
Best Practices
Weight Configuration:
- Always ensure weights sum to exactly 100
- Start with small percentages for new versions (5-10%)
- Increase gradually based on metrics and confidence
- Document weight changes and rationale
Monitoring:
- Watch error rates closely during traffic shifts
- Monitor latency for both versions
- Set up alerts for anomalies
- Use Grafana/Kiali for real-time visualization
Rollback Strategy:
- Keep previous version running during migration
- Have rollback plan ready (adjust weights back)
- Test rollback procedure in staging first
- Document rollback steps for team
Testing:
- Validate new version in staging before production
- Use small traffic percentages initially
- Monitor for at least 24 hours at each phase
- Verify business metrics, not just technical metrics
Traffic routing = Control where requests go based on percentage weights
Two approaches: HTTPRoute (Kubernetes standard, simpler) or VirtualService (Istio-specific, more features)
Weights = Percentage split that must sum to 100 (e.g., 70+30, 90+10)
Canary pattern = Gradual rollout starting with small percentage (5-10%) to new version
Gateway binding = Exposes service to external traffic through gateway
Host matching = Gateway hosts filter incoming traffic; VirtualService hosts define routing
Common use cases: Canary deployments, A/B testing, gradual rollouts, blue-green deployments
Key benefit = Zero-downtime deployments with easy rollback capability
Configuration-only = No application code changes required
Subsets and DestinationRule
What are Subsets?
Subsets = Named groups of service instances (pods) representing different versions of the same service.
Purpose: Enable version-specific routing by grouping pods with common labels.
How it works: Uses pod labels to identify which instances belong to which subset.
Example scenario:
- Pods with label
version: v1→ subset v1 - Pods with label
version: v2→ subset v2 - Both subsets share same service name but represent different versions
Analogy: Like organizing books by edition - same title, different versions.
What is DestinationRule?
DestinationRule = Istio resource that defines subsets and traffic policies for a service.
Two main functions:
- Subset Definition: Group pods by labels (v1, v2, v3)
- Traffic Policies: Configure how traffic is handled (load balancing, connection limits, circuit breaking)
Relationship with VirtualService:
- VirtualService: Decides WHERE to send traffic (which subset)
- DestinationRule: Defines WHAT subsets exist and HOW to handle traffic
Basic DestinationRule Example
apiVersion: networking.istio.io/v1
kind: DestinationRule
metadata:
  name: customers-destination
spec:
  host: customers.default.svc.cluster.local
  subsets:
  - name: v1
    labels:
      version: v1
  - name: v2
    labels:
      version: v2
Configuration breakdown:
- host: Target service (customers.default.svc.cluster.local)
- subsets: List of named subsets
- name: Subset identifier (v1, v2) - referenced by VirtualService
- labels: Pod label selector (version: v1 or version: v2)
What this does:
- Defines 2 subsets for
customersservice - Subset v1 = all pods with label
version: v1 - Subset v2 = all pods with label
version: v2 - Enables VirtualService to route to specific versions
Traffic Policies
Traffic policies = Configuration rules applied AFTER routing decisions are made, controlling HOW traffic is handled at the destination.
When applied: After VirtualService determines WHERE to send traffic, DestinationRule policies control HOW that traffic is processed.
Five policy types:
- Load Balancer Settings: Algorithm for distributing requests across pods
- Connection Pool Settings: Limits on concurrent connections and requests
- Outlier Detection: Circuit breaker for removing unhealthy instances
- Client TLS Settings: Encryption configuration for service-to-service communication
- Port Traffic Policy: Different policies for different ports
1. Load Balancer Settings
Purpose: Choose algorithm for distributing traffic across pods in a subset
Simple Load Balancing Algorithms
Configuration example:
spec:
  host: customers.default.svc.cluster.local
  trafficPolicy:
    loadBalancer:
      simple: ROUND_ROBIN
  subsets:
  - name: v1
    labels:
      version: v1
Available algorithms:
| Algorithm | Behavior | Best For | Example |
|---|---|---|---|
| ROUND_ROBIN | Distributes requests evenly in sequence | Even load distribution | Pod1 → Pod2 → Pod3 → Pod1 |
| LEAST_CONN | Routes to pod with fewest active connections | Varying request durations | Long-running requests |
| RANDOM | Selects pod randomly | Simple, stateless workloads | Quick requests |
| PASSTHROUGH | Uses original destination (no load balancing) | Direct pod access | Debugging |
Default behavior: If not specified, Istio uses ROUND_ROBIN.
Hash-Based Load Balancing (Session Affinity)
Purpose: Ensure same user always reaches same pod (sticky sessions)
Configuration example:
trafficPolicy:
  loadBalancer:
    consistentHash:
      httpCookie:
        name: location
        ttl: 4s
Configuration breakdown:
- consistentHash: Enables hash-based routing
- httpCookie.name: Cookie name to hash (location)
- ttl: Cookie lifetime (4 seconds)
What this does: Routes requests with same cookie value to same pod consistently.
Hash options:
| Hash Type | Field | Use Case | Example |
|---|---|---|---|
| httpCookie | name, ttl | Session persistence | Shopping cart |
| httpHeaderName | Header name | User-based routing | x-user-id |
| httpQueryParameterName | Query param | URL-based routing | ?user=123 |
| useSourceIp | Boolean | IP-based routing | Geographic routing |
Use cases: Shopping carts, user sessions, stateful applications, WebSocket connections.
2. Connection Pool Settings
Purpose: Limit concurrent connections and requests to prevent service overload
Configuration example:
trafficPolicy:
  connectionPool:
    http:
      http2MaxRequests: 50
      http1MaxPendingRequests: 10
      maxRequestsPerConnection: 2
Configuration breakdown:
- http2MaxRequests: Maximum concurrent HTTP/2 requests (50)
- http1MaxPendingRequests: Maximum queued HTTP/1.1 requests (10)
- maxRequestsPerConnection: Maximum requests per connection (2)
What this does: Limits concurrent requests to 50, protecting service from overload.
Key fields:
| Field | Protocol | Purpose | Example Value |
|---|---|---|---|
| http1MaxPendingRequests | HTTP/1.1 | Queue limit for pending requests | 10 |
| http2MaxRequests | HTTP/2 | Concurrent request limit | 50 |
| maxRequestsPerConnection | Both | Requests per connection | 2 |
| maxRetries | Both | Concurrent retry limit | 3 |
Use cases: Protecting services from traffic spikes, preventing resource exhaustion, capacity management.
3. Outlier Detection (Circuit Breaker)
Purpose: Automatically remove unhealthy pods from load balancing pool, allowing them time to recover
Configuration example:
trafficPolicy:
  connectionPool:
    http:
      http2MaxRequests: 500
      maxRequestsPerConnection: 10
  outlierDetection:
    consecutiveErrors: 10
    interval: 5m
    baseEjectionTime: 10m
    maxEjectionPercent: 50
Configuration breakdown:
- consecutiveErrors: Failure threshold before ejection (10 errors)
- interval: Health check frequency (every 5 minutes)
- baseEjectionTime: Minimum ejection duration (10 minutes)
- maxEjectionPercent: Maximum percentage of hosts that can be ejected (50%)
What this does:
- Monitors pod health every 5 minutes
- If pod fails 10 consecutive times → eject from pool
- Keep ejected for minimum 10 minutes
- Never eject more than 50% of pods (prevents cascading failure)
Key fields:
| Field | Purpose | Example Value | Impact |
|---|---|---|---|
| consecutiveErrors | Failure threshold | 10 | Sensitivity to failures |
| interval | Check frequency | 5m | Detection speed |
| baseEjectionTime | Minimum ejection duration | 10m | Recovery time |
| maxEjectionPercent | Maximum ejection percentage | 50 | Availability protection |
| consecutive5xxErrors | HTTP 5xx threshold | 5 | Server error sensitivity |
Analogy: Like benching an injured player - remove from rotation, allow recovery time, then return to game.
Use cases: Automatic failure handling, self-healing systems, preventing cascading failures.
4. Client TLS Settings
Purpose: Configure TLS/SSL encryption for service-to-service communication
Configuration example:
trafficPolicy:
  tls:
    mode: MUTUAL
    clientCertificate: /etc/certs/cert.pem
    privateKey: /etc/certs/key.pem
    caCertificates: /etc/certs/ca.pem
Configuration breakdown:
- mode: TLS mode (MUTUAL = two-way authentication)
- clientCertificate: Client certificate path
- privateKey: Private key path
- caCertificates: Certificate authority certificates
TLS modes:
| Mode | Description | Authentication | Use Case |
|---|---|---|---|
| DISABLE | No encryption | None | Development only |
| SIMPLE | One-way TLS | Server only | Public APIs |
| MUTUAL | Two-way TLS | Both client and server | Internal services |
| ISTIO_MUTUAL | Istio-managed mTLS | Automatic | Recommended for mesh |
Recommendation: Use ISTIO_MUTUAL for automatic certificate management within the mesh.
Use cases: Secure service-to-service communication, compliance requirements, zero-trust networking.
5. Port Traffic Policy
Purpose: Apply different traffic policies to different ports on the same service
Configuration example:
trafficPolicy:
  portLevelSettings:
  - port:
      number: 80
    loadBalancer:
      simple: LEAST_CONN
  - port:
      number: 8000
    loadBalancer:
      simple: ROUND_ROBIN
  - port:
      number: 443
    connectionPool:
      http:
        http2MaxRequests: 100
Configuration breakdown:
- Port 80: Uses LEAST_CONN load balancing
- Port 8000: Uses ROUND_ROBIN load balancing
- Port 443: Limits to 100 concurrent HTTP/2 requests
What this does: Applies different traffic policies based on port number.
Use cases:
- Different load balancing for HTTP vs HTTPS
- Stricter limits on admin ports
- Custom policies for metrics endpoints
- Port-specific connection limits
How VirtualService and DestinationRule Work Together
Traffic flow sequence:
1. Request arrives at service mesh
   ↓
2. VirtualService evaluates routing rules (WHERE to send)
   ↓
3. VirtualService selects destination subset (e.g., v1 or v2)
   ↓
4. DestinationRule defines subset membership (pods with version: v1)
   ↓
5. DestinationRule applies traffic policies (HOW to send)
   ↓
6. Request routed to selected pod with configured policies
Example scenario:
VirtualService says:
- "Send 70% of traffic to subset v1"
- "Send 30% of traffic to subset v2"
DestinationRule says:
- "Subset v1 = pods with label version:v1"
- "Use ROUND_ROBIN load balancing for v1"
- "Limit to 50 concurrent requests for v1"
Result: 70% of traffic goes to v1 pods, distributed via ROUND_ROBIN, with 50 request limit.
Key principle: VirtualService handles routing decisions (WHERE), DestinationRule handles subset definitions and policies (WHAT and HOW).
Traffic Policy Scope
Global vs Subset-Level Policies:
spec:
  host: customers.default.svc.cluster.local
  trafficPolicy:  # Global policy (applies to all subsets)
    loadBalancer:
      simple: ROUND_ROBIN
  subsets:
  - name: v1
    labels:
      version: v1
    trafficPolicy:  # Subset-specific policy (overrides global)
      loadBalancer:
        simple: LEAST_CONN
  - name: v2
    labels:
      version: v2
    # Inherits global ROUND_ROBIN policy
Policy precedence: Subset-level policies override global policies.
Traffic Policy Reference
| Policy Type | Purpose | Key Configuration | Use Case |
|---|---|---|---|
| Load Balancer | Distribute traffic across pods | simple: ROUND_ROBIN | Even distribution |
| Connection Pool | Limit concurrent connections | http2MaxRequests: 50 | Prevent overload |
| Outlier Detection | Remove unhealthy instances | consecutiveErrors: 10 | Circuit breaking |
| TLS Settings | Encryption configuration | mode: ISTIO_MUTUAL | Secure communication |
| Port Policy | Port-specific rules | portLevelSettings | Different port behaviors |
Configuration Examples by Use Case
High-Traffic Service
trafficPolicy:
  connectionPool:
    http:
      http2MaxRequests: 1000
      maxRequestsPerConnection: 10
  loadBalancer:
    simple: LEAST_CONN
Stateful Application
trafficPolicy:
  loadBalancer:
    consistentHash:
      httpCookie:
        name: session-id
        ttl: 3600s
Resilient Service
trafficPolicy:
  connectionPool:
    http:
      http2MaxRequests: 100
  outlierDetection:
    consecutiveErrors: 5
    interval: 30s
    baseEjectionTime: 30s
Best Practices
Subset Management:
- Use consistent labeling strategy across all deployments (
version: v1,version: v2) - Keep subset names simple and descriptive (v1, v2, canary, stable)
- Document subset purposes and version differences
- Ensure pod labels match DestinationRule subset selectors
Load Balancing:
- Use
ROUND_ROBINfor even distribution across pods (default choice) - Use
LEAST_CONNfor requests with varying processing times - Use
consistentHashfor session affinity requirements (stateful apps) - Test load balancing behavior under realistic traffic patterns
Connection Pool Settings:
- Start with conservative limits based on service capacity
- Monitor connection pool metrics (queue depth, rejections)
- Adjust limits gradually based on observed behavior
- Consider downstream service capacity when setting limits
Circuit Breaking:
- Set conservative thresholds initially (5-10 consecutive errors)
- Monitor ejection rates and adjust based on false positives
- Never eject more than 50% of instances (prevent cascading failures)
- Balance sensitivity vs availability
TLS Configuration:
- Use
ISTIO_MUTUALfor automatic certificate management - Only use
DISABLEin development environments - Regularly rotate certificates for
MUTUALmode - Monitor certificate expiration dates
Testing:
- Test subset routing before production deployment
- Verify traffic policies under load
- Validate circuit breaker behavior with failure injection
- Monitor metrics after configuration changes
Common Patterns
Pattern 1: Canary Deployment with Circuit Breaking
spec:
  host: customers.default.svc.cluster.local
  trafficPolicy:
    connectionPool:
      http:
        http2MaxRequests: 100
    outlierDetection:
      consecutiveErrors: 5
      interval: 30s
      baseEjectionTime: 30s
  subsets:
  - name: stable
    labels:
      version: v1
  - name: canary
    labels:
      version: v2
Pattern 2: Session Affinity for Stateful Apps
spec:
  host: app.default.svc.cluster.local
  trafficPolicy:
    loadBalancer:
      consistentHash:
        httpCookie:
          name: session-id
          ttl: 3600s
  subsets:
  - name: v1
    labels:
      version: v1
Pattern 3: Different Policies per Subset
spec:
  host: api.default.svc.cluster.local
  subsets:
  - name: v1
    labels:
      version: v1
    trafficPolicy:
      connectionPool:
        http:
          http2MaxRequests: 50  # Conservative for old version
  - name: v2
    labels:
      version: v2
    trafficPolicy:
      connectionPool:
        http:
          http2MaxRequests: 200  # Higher for optimized version
Subset = Named group of pods representing a service version (identified by labels)
DestinationRule = Defines subsets AND traffic policies (WHAT exists and HOW to handle)
VirtualService = Defines routing rules (WHERE to send traffic)
Relationship: VirtualService routes to subsets defined by DestinationRule
Traffic policies = Applied AFTER routing decisions (load balancing, limits, circuit breaking)
Five policy types:
- Load Balancer = Distribution algorithm (ROUND_ROBIN, LEAST_CONN, consistentHash)
- Connection Pool = Concurrent request limits (prevent overload)
- Outlier Detection = Circuit breaker (remove unhealthy pods)
- TLS Settings = Encryption configuration (ISTIO_MUTUAL recommended)
- Port Policy = Port-specific configurations
Policy scope = Global (all subsets) or subset-specific (overrides global)
Use cases: Version management, canary deployments, session affinity, resilience, security
Configuration-only = No application code changes required
Resiliency
What is Resiliency?
Resiliency = The ability to maintain service availability and functionality even when failures occur. It's not about preventing failures, but handling them gracefully to minimize impact.
Core principle: Failures are inevitable in distributed systems - design for failure, not perfection.
Goal: Minimize downtime, prevent cascading failures, and maintain acceptable service levels during partial system failures.
Analogy: Like having airbags in a car - you hope never to need them, but they're critical when accidents happen.
Istio Resiliency Mechanisms
Four main mechanisms for building resilient applications:
| Mechanism | Purpose | Configuration | Impact |
|---|---|---|---|
| Timeouts | Prevent indefinite waiting | VirtualService | Fail fast |
| Retries | Handle transient failures | VirtualService | Automatic recovery |
| Circuit Breaking | Prevent overload | DestinationRule | Load protection |
| Outlier Detection | Remove unhealthy instances | DestinationRule | Self-healing |
Key benefit: All mechanisms are configured declaratively - no application code changes required.
1. Timeouts
Purpose: Prevent requests from waiting indefinitely for slow or unresponsive services
Why needed: Without timeouts, slow services can block threads, exhaust resources, and cause cascading failures throughout the system.
Configuration example:
apiVersion: networking.istio.io/v1
kind: VirtualService
metadata:
  name: customers-service
  namespace: default
spec:
  hosts:
  - customers.default.svc.cluster.local
  http:
  - route:
    - destination:
        host: customers.default.svc.cluster.local
        subset: v1
    timeout: 10s
Configuration breakdown:
- timeout: 10s: Maximum wait time for response (10 seconds)
- Applies to: Entire request-response cycle
- On timeout: Returns HTTP 504 (Gateway Timeout) to caller
- Connection: Remains open unless circuit breaker triggers
What this does:
- Waits maximum 10 seconds for service response
- If no response within 10s → Returns timeout error
- Prevents indefinite blocking of client threads
- Allows client to handle timeout gracefully
Timeout values guidance:
| Service Type | Recommended Timeout | Rationale |
|---|---|---|
| Fast APIs | 1-3s | Quick operations, fail fast |
| Standard APIs | 5-10s | Normal processing time |
| Database queries | 10-30s | Complex queries may take longer |
| Batch operations | 30-60s | Long-running operations |
| External APIs | 15-30s | Account for network latency |
Use cases: Preventing slow services from blocking resources, failing fast, maintaining system responsiveness.
2. Retries
Purpose: Automatically retry failed requests to handle transient failures without manual intervention
When to use: Transient network issues, temporary service unavailability, intermittent errors
Critical requirement: Only use for idempotent operations (safe to repeat without side effects)
Idempotent operations:
- ✅ Safe: GET, HEAD, OPTIONS, PUT (with same data), DELETE (same resource)
- ❌ Unsafe: POST (creates new resources), non-idempotent PUT operations
Why idempotency matters: Retrying non-idempotent operations can cause duplicate actions (e.g., charging credit card twice).
Configuration example:
apiVersion: networking.istio.io/v1
kind: VirtualService
metadata:
  name: customers-service
  namespace: default
spec:
  hosts:
  - customers.default.svc.cluster.local
  http:
  - route:
    - destination:
        host: customers.default.svc.cluster.local
        subset: v1
    retries:
      attempts: 3
      perTryTimeout: 2s
      retryOn: 5xx,connect-failure,reset
Configuration breakdown:
- attempts: 3: Maximum retry attempts (total tries = 1 initial + 3 retries = 4 total)
- perTryTimeout: 2s: Timeout for each individual attempt (2 seconds)
- retryOn: Conditions that trigger retry (comma-separated list)
What this does:
- Attempts request up to 3 additional times after initial failure
- Each attempt has 2-second timeout
- Only retries on specified failure conditions
- Total maximum time: 8 seconds (4 attempts × 2s each)
Retry conditions reference:
| Condition | When It Triggers | Use Case | Example |
|---|---|---|---|
| 5xx | Server errors (500-599) | Backend failures | 500, 503, 504 |
| connect-failure | Cannot establish connection | Network issues | Connection refused |
| reset | Connection reset by peer | Abrupt disconnections | TCP reset |
| gateway-error | Bad gateway responses | Proxy errors | 502, 503, 504 |
| refused-stream | HTTP/2 stream refused | Protocol issues | Stream rejection |
| retriable-4xx | Specific 4xx errors | Client errors | 409 Conflict |
| retriable-status-codes | Custom status codes | Specific codes | 429 Rate Limit |
Important rules:
- Total time constraint: Combined retry time never exceeds main timeout (if configured)
- Exponential backoff: Not shown in example, but recommended for production
- Retry budget: Consider limiting retries to prevent retry storms
Use cases: Handling transient network failures, temporary service unavailability, intermittent errors.
3. Circuit Breaking
Purpose: Limit concurrent connections and requests to prevent service overload and cascading failures
Analogy: Like an electrical circuit breaker - stops flow when system is overloaded to prevent damage.
How it works: Sets maximum limits on connections, requests, and retries. When limits are reached, additional requests are rejected immediately (fail fast) rather than queuing indefinitely.
Configuration example:
apiVersion: networking.istio.io/v1
kind: DestinationRule
metadata:
  name: customers-destination
spec:
  host: customers.default.svc.cluster.local
  trafficPolicy:
    connectionPool:
      http:
        maxRequestsPerConnection: 1
        maxRetries: 3
    outlierDetection:
      consecutive5xxErrors: 5
      interval: 10s
      baseEjectionTime: 30s
Configuration breakdown:
- maxRequestsPerConnection: 1: Maximum requests per HTTP connection
- maxRetries: 3: Maximum concurrent retry requests allowed
- consecutive5xxErrors: 5: Threshold for ejecting unhealthy instance
- interval: 10s: Health check frequency
- baseEjectionTime: 30s: Minimum ejection duration
What this does:
- Limits 1 request per connection (forces connection reuse)
- Allows maximum 3 concurrent retries
- Monitors for consecutive failures (5 errors triggers ejection)
- Checks health every 10 seconds
- Ejects failing instances for at least 30 seconds
Circuit breaker states:
| State | Behavior | Trigger | Recovery |
|---|---|---|---|
| Closed | Normal operation | Default state | N/A |
| Open | Reject requests immediately | Limits exceeded | After timeout |
| Half-Open | Allow limited requests | Testing recovery | Success restores |
Use cases: Protecting services from overload, preventing cascading failures, maintaining system stability under stress.
4. Outlier Detection
Purpose: Automatically identify and remove unhealthy service instances from the load balancing pool, allowing them time to recover.
How it works:
1. Monitor instance health continuously
   ↓
2. Track consecutive failures per instance
   ↓
3. If failures exceed threshold → Eject instance from pool
   ↓
4. Wait for ejection time period
   ↓
5. Return instance to pool for testing
   ↓
6. Repeat monitoring cycle
Configuration: Already shown in circuit breaking example above (part of DestinationRule)
Key fields explained:
| Field | Purpose | Example Value | Impact |
|---|---|---|---|
| consecutive5xxErrors | Failure threshold | 5 | Sensitivity to errors |
| interval | Check frequency | 10s | Detection speed |
| baseEjectionTime | Minimum ejection | 30s | Recovery time |
| maxEjectionPercent | Maximum ejected | 50% | Availability protection |
Ejection logic: Instance is removed from load balancing rotation but remains running - it's not terminated, just temporarily excluded.
Use cases: Automatic failure handling, self-healing systems, preventing traffic to unhealthy instances, gradual recovery testing.
Combining Timeouts and Retries
How they interact: Timeouts and retries work together, with total retry time constrained by the overall timeout.
Example scenario:
- Main timeout: 10 seconds
- Retry attempts: 3
- Per-try timeout: 2 seconds
Execution flow:
Attempt 1: Wait 2s → Timeout → Retry
Attempt 2: Wait 2s → Timeout → Retry
Attempt 3: Wait 2s → Timeout → Retry
Attempt 4: Wait 2s → Timeout → Give up
Total time: 8 seconds (within 10s main timeout)
Critical rule: Total retry time never exceeds main timeout value.
Configuration example:
http:
- route:
  - destination:
      host: service.default.svc.cluster.local
  timeout: 10s
  retries:
    attempts: 3
    perTryTimeout: 2s
Best practice: Set perTryTimeout × (attempts + 1) ≤ timeout
Resiliency in Ambient Mode
Key difference: Traffic policies are enforced at different layers depending on traffic type.
L4 Traffic (Network Layer)
Handled by: ztunnel (node-level proxy)
Capabilities:
- Basic connection timeouts
- TCP-level retries
- Connection pooling
- Simple load balancing
Limitations: No HTTP-aware features (no HTTP retries, no header-based routing)
L7 Traffic (Application Layer)
Handled by: Waypoint proxies (namespace or service level)
Capabilities:
- HTTP-based retries with conditions
- Circuit breaking with HTTP status codes
- Advanced traffic policies
- Full VirtualService features
Configuration approach: Same YAML resources (VirtualService, DestinationRule), but enforcement happens at different proxy layers.
Deployment consideration: Deploy waypoint proxies for L7 resiliency features.
Resiliency Mechanism Reference
| Mechanism | Resource | Key Fields | Default Behavior |
|---|---|---|---|
| Timeout | VirtualService | timeout | No timeout (waits indefinitely) |
| Retry | VirtualService | attempts, perTryTimeout, retryOn | No automatic retries |
| Circuit Breaker | DestinationRule | connectionPool | No limits |
| Outlier Detection | DestinationRule | outlierDetection | No ejection |
Retry Conditions Reference
| Condition | Triggers On | Common Scenarios | Recommended Use |
|---|---|---|---|
| 5xx | Server errors (500-599) | Backend failures | Always include |
| connect-failure | Connection refused | Service down | Always include |
| reset | Connection reset | Network issues | Always include |
| gateway-error | Bad gateway (502, 503, 504) | Proxy errors | Include for proxied services |
| refused-stream | HTTP/2 stream refused | Protocol issues | Include for HTTP/2 |
| retriable-4xx | Specific 4xx errors | Conflict, rate limit | Use selectively |
Best Practices
Timeout Configuration:
- Set realistic values: Base on actual service performance (not too short, not too long)
- Consider downstream chains: Account for cumulative timeouts in service chains
- Add buffer: Include network latency and processing time
- Monitor P99 latency: Set timeout above 99th percentile response time
- Test under load: Validate timeout values with realistic traffic patterns
Retry Configuration:
- Idempotency first: Only retry idempotent operations (GET, HEAD, PUT, DELETE)
- Limit attempts: Use 3-5 maximum retry attempts to prevent retry storms
- Set per-try timeout: Always configure
perTryTimeoutto prevent long waits - Choose conditions carefully: Only retry on transient errors (5xx, connect-failure, reset)
- Implement exponential backoff: Add delays between retries (requires custom implementation)
- Monitor retry rates: Track retry metrics to identify problematic services
Circuit Breaking Configuration:
- Base on capacity: Set limits based on actual service capacity testing
- Start conservative: Begin with lower limits and increase based on monitoring
- Monitor rejection rates: Track circuit breaker activations
- Consider peak traffic: Account for traffic spikes and seasonal patterns
- Test failure scenarios: Validate circuit breaker behavior under load
Outlier Detection Configuration:
- Check frequently: Use 5-10 second intervals for quick detection
- Eject temporarily: Use 30-60 second ejection times for recovery
- Limit ejection percentage: Never eject more than 50% of instances
- Balance sensitivity: Too aggressive = false positives, too lenient = slow detection
- Monitor ejection events: Track which instances are ejected and why
Testing Strategy:
- Test in isolation: Validate each mechanism separately before combining
- Use failure injection: Test resiliency with Istio fault injection
- Simulate realistic failures: Test with actual failure scenarios
- Monitor during tests: Watch metrics to verify expected behavior
- Document findings: Record test results and configuration decisions
Resiliency Patterns Summary
| Pattern | Purpose | Configuration | Typical Values | Best For |
|---|---|---|---|---|
| Timeout | Prevent hanging requests | timeout: 10s | 5-30s | Slow services |
| Retry | Handle transient failures | attempts: 3, perTryTimeout: 2s | 3-5 attempts | Network issues |
| Circuit Breaker | Prevent overload | http2MaxRequests: 100 | Based on capacity | Load protection |
| Outlier Detection | Remove failing instances | consecutiveErrors: 5 | 5-10 errors | Automatic recovery |
Configuration Examples by Scenario
High-Availability Service
http:
- route:
  - destination:
      host: critical-service.default.svc.cluster.local
  timeout: 5s
  retries:
    attempts: 3
    perTryTimeout: 1s
    retryOn: 5xx,connect-failure,reset
External API Integration
http:
- route:
  - destination:
      host: external-api.default.svc.cluster.local
  timeout: 30s
  retries:
    attempts: 2
    perTryTimeout: 10s
    retryOn: connect-failure,refused-stream
High-Traffic Service with Circuit Breaking
trafficPolicy:
  connectionPool:
    http:
      http2MaxRequests: 1000
      maxRequestsPerConnection: 10
  outlierDetection:
    consecutive5xxErrors: 5
    interval: 10s
    baseEjectionTime: 30s
    maxEjectionPercent: 50
Resiliency = Handle failures gracefully to prevent cascading effects and maintain service availability
Four mechanisms:
- Timeouts = Fail fast instead of waiting indefinitely (typically 5-30s)
- Retries = Automatically recover from transient failures (3-5 attempts with 1-2s per try)
- Circuit Breaker = Protect services from overload by limiting concurrent requests
- Outlier Detection = Automatically remove unhealthy instances (5-10 errors → eject 30-60s)
Configuration location:
- VirtualService: Timeouts and retries (routing-level policies)
- DestinationRule: Circuit breaking and outlier detection (destination-level policies)
Ambient mode differences:
- L4 traffic: ztunnel handles basic timeouts and connection limits
- L7 traffic: Waypoint proxies handle HTTP retries and advanced policies
Key principles:
- Fail fast: Use timeouts to prevent indefinite waiting
- Retry smart: Only retry idempotent operations on transient errors
- Protect capacity: Use circuit breakers to prevent overload
- Self-heal: Use outlier detection for automatic recovery
Use for: Preventing cascading failures, improving reliability, automatic recovery, maintaining SLAs
Configuration-only: No application code changes required - all declarative
Failure Injection
What is Failure Injection?
Failure injection = Deliberately introducing failures into your system to test application resilience and error handling capabilities.
Purpose: Proactively validate that your application handles failures gracefully before encountering them in production.
Part of: Chaos engineering - the practice of experimenting on distributed systems to build confidence in their ability to withstand turbulent conditions.
Analogy: Like fire drills or disaster recovery exercises - practice handling emergencies in controlled conditions.
Key benefit: Identify and fix resilience issues during testing rather than discovering them during production incidents.
Two Types of Failure Injection
Istio supports two failure injection mechanisms:
| Type | Simulates | Tests | Configuration Field |
|---|---|---|---|
| Abort | Service failures | Error handling | fault.abort |
| Delay | Network latency | Timeout handling | fault.delay |
Both can be combined: Test complex failure scenarios with both errors and delays simultaneously.
1. Abort - Injecting Errors
Purpose: Simulate service failures by returning HTTP error codes without calling the actual service
Use cases: Test error handling, fallback mechanisms, graceful degradation, user-facing error messages
Configuration example:
apiVersion: networking.istio.io/v1
kind: VirtualService
metadata:
  name: customers-service
  namespace: default
spec:
  hosts:
  - "customers.example.com"
  gateways:
  - my-gateway
  http:
  - route:
    - destination:
        host: customers.default.svc.cluster.local
        subset: v1
    fault:
      abort:
        percentage:
          value: 30
        httpStatus: 404
Configuration breakdown:
- fault.abort: Enables error injection
- percentage.value: 30: Affects 30% of requests
- httpStatus: 404: Returns HTTP 404 (Not Found) error
- Result: 30% fail with 404, 70% proceed normally
What this does:
- Intercepts 30% of matching requests at proxy level
- Returns HTTP 404 error immediately (no backend call)
- Remaining 70% of requests proceed to actual service
- Simulates service returning "Not Found" errors
Common HTTP error codes for testing:
| Error Code | Meaning | Test Scenario | When to Use |
|---|---|---|---|
| 400 | Bad Request | Invalid input handling | Client error validation |
| 404 | Not Found | Missing resource handling | Resource availability |
| 429 | Too Many Requests | Rate limiting | Throttling behavior |
| 500 | Internal Server Error | Server failure | General error handling |
| 503 | Service Unavailable | Service downtime | Unavailability scenarios |
| 504 | Gateway Timeout | Timeout scenarios | Timeout handling |
Use cases: Testing error handling, validating fallback mechanisms, verifying user-facing error messages, testing retry logic.
2. Delay - Injecting Latency
Purpose: Simulate network latency or slow service response times by adding artificial delays before forwarding requests
Use cases: Test timeout handling, loading states, user experience with slow backends, cascading delay effects
Configuration example:
apiVersion: networking.istio.io/v1
kind: VirtualService
metadata:
  name: customers-service
  namespace: default
spec:
  hosts:
  - "customers.example.com"
  gateways:
  - my-gateway
  http:
  - route:
    - destination:
        host: customers.default.svc.cluster.local
        subset: v1
    fault:
      delay:
        percentage:
          value: 5
        fixedDelay: 3s
Configuration breakdown:
- fault.delay: Enables latency injection
- percentage.value: 5: Affects 5% of requests
- fixedDelay: 3s: Adds 3-second delay
- Result: 5% delayed by 3s, 95% proceed normally
What this does:
- Intercepts 5% of matching requests at proxy level
- Waits 3 seconds before forwarding to backend service
- Backend service still processes request normally (just delayed)
- Simulates slow network or overloaded service
Delay duration guidance:
| Delay Duration | Simulates | Test Scenario | Typical Use |
|---|---|---|---|
| 1-2s | Slow network | Minor latency | Network congestion |
| 3-5s | Overloaded service | Moderate delay | High load conditions |
| 5-10s | Very slow service | Severe delay | Near-timeout scenarios |
| 10-30s | Timeout scenarios | Extreme delay | Timeout validation |
Use cases: Testing timeout configurations, validating loading indicators, testing user patience thresholds, cascading delay effects.
Combining Abort and Delay
Purpose: Test complex failure scenarios with both errors and latency simultaneously
Configuration example:
fault:
  abort:
    percentage:
      value: 10
    httpStatus: 500
  delay:
    percentage:
      value: 20
    fixedDelay: 5s
Configuration breakdown:
- abort: 10% of requests return HTTP 500 error
- delay: 20% of requests delayed by 5 seconds
- Percentages are independent: Different requests affected
What this does:
- 10% of requests → Immediate HTTP 500 error (no backend call)
- 20% of requests → 5-second delay then forwarded to backend
- 70% of requests → Proceed normally without interference
Important: Abort and delay affect different request subsets - they don't overlap.
Use case: Simulate realistic production conditions where some requests fail and others are slow.
Important Considerations
Percentage Field Behavior
Default behavior (percentage not specified):
- Affects 100% of matching requests
- All traffic to the route experiences the fault
Specified percentage:
- Affects only the specified percentage of requests
- Selection is random for each request
- Remaining requests proceed normally
Example: percentage.value: 30 means approximately 30 out of every 100 requests are affected.
Scope and Targeting
VirtualService-specific:
- Only affects traffic matching THIS specific VirtualService
- Does NOT affect all consumers of the service globally
- Targeted to specific routes, hosts, or gateways
Example: If you have multiple VirtualServices for the same service, fault injection in one doesn't affect the others.
Routing specificity: Can target specific paths, headers, or other match conditions within the VirtualService.
Interaction with Retry Policies
Critical limitation: Fault injection does NOT trigger configured retry policies!
Why this happens:
- Fault injection occurs at the proxy level
- Injected faults bypass retry logic
- Retries only trigger for actual backend failures
Example scenario:
# Configuration
fault:
  abort:
    httpStatus: 500
retries:
  attempts: 3
  retryOn: 5xx
Result: Injected 500 errors are NOT retried, even though retry policy says to retry 5xx errors.
Workaround: To test retry behavior, use actual service failures or outlier detection instead of fault injection.
Gateway API Limitation
Current status: Kubernetes Gateway API does NOT support fault injection (as of v1.2.1)
Alternative: Must use Istio VirtualService for fault injection capabilities
Future: Fault injection may be added to Gateway API in future versions
Testing Scenarios
Scenario 1: Test Error Handling
Configuration:
fault:
  abort:
    percentage:
      value: 50
    httpStatus: 503
What it tests:
- Does application display user-friendly error messages?
- Are errors logged properly for debugging?
- Does application attempt retries (if applicable)?
- Is fallback behavior triggered correctly?
- Do monitoring alerts fire appropriately?
Expected behavior: Application should handle 50% failure rate gracefully without crashing.
Scenario 2: Test Timeout Handling
Configuration:
fault:
  delay:
    percentage:
      value: 100
    fixedDelay: 15s
What it tests:
- Does application timeout properly (if timeout < 15s)?
- Are loading indicators displayed to users?
- Does application remain responsive during delays?
- Are timeout errors handled gracefully?
- Do users receive appropriate feedback?
Expected behavior: Application should timeout and show appropriate message if timeout is less than 15 seconds.
Scenario 3: Test Partial Failures
Configuration:
fault:
  abort:
    percentage:
      value: 10
    httpStatus: 500
What it tests:
- Does application continue functioning with 10% failure rate?
- Are successful requests unaffected by failures?
- Does application degrade gracefully?
- Are error rates monitored and alerted?
- Can users complete critical workflows?
Expected behavior: Application should remain functional with acceptable user experience despite 10% error rate.
Scenario 4: Test Cascading Delays
Configuration:
fault:
  delay:
    percentage:
      value: 30
    fixedDelay: 5s
What it tests:
- Do delays in one service cascade to dependent services?
- Are timeouts configured appropriately across service chain?
- Does system recover when delays stop?
- Are resources (threads, connections) exhausted?
Expected behavior: System should handle delays without resource exhaustion or cascading failures.
Scenario 5: Test Combined Failures
Configuration:
fault:
  abort:
    percentage:
      value: 15
    httpStatus: 503
  delay:
    percentage:
      value: 25
    fixedDelay: 3s
What it tests:
- Can application handle both errors and delays simultaneously?
- Does combination cause worse behavior than individual faults?
- Are monitoring systems detecting both types of issues?
Expected behavior: Application should handle combined failures as well as individual ones.
Best Practices
Start Small:
- Begin with 5-10% of traffic
- Gradually increase if needed
- Monitor application behavior closely
Test in Non-Production First:
- Use in dev/staging environments
- Don't test in production (unless you know what you're doing)
- Have rollback plan ready
Monitor Impact:
- Watch metrics while testing
- Check if app handles failures gracefully
- Verify error messages are user-friendly
Document Tests:
- Record what you tested and results
- Note how app behaved under different failure scenarios
- Share findings with development team
Remove After Testing:
- Don't leave fault injection enabled permanently
- Remove or set percentage to 0 when done
- Clean up test configurations
Failure Injection Reference
| Type | What It Does | Example | Use Case |
|---|---|---|---|
| Abort | Return error code | 30% get HTTP 404 | Test error handling |
| Delay | Add wait time | 5% wait 3 seconds | Test timeout handling |
| Both | Errors + delays | 10% error, 20% delay | Comprehensive testing |
Common Testing Scenarios
| Scenario | Configuration | What It Tests | Expected Behavior |
|---|---|---|---|
| Service down | abort: 100%, httpStatus: 503 | Total failure handling | Graceful degradation |
| Intermittent errors | abort: 10%, httpStatus: 500 | Partial failure handling | Retry mechanisms |
| Slow network | delay: 100%, fixedDelay: 5s | Timeout handling | Loading states |
| Flaky service | abort: 30%, httpStatus: 503 | Retry logic | Circuit breaker activation |
- Gateway API: Does NOT support fault injection yet
- Retry bypass: Fault injection does NOT trigger retry policies
- Scope: Only affects traffic using the specific VirtualService
Failure injection = Intentionally break things to test resilience (chaos engineering)
Abort = Fake errors (HTTP 404, 500, 503) to test error handling
Delay = Fake slowness (3s, 5s delays) to test timeout handling
Percentage = How much traffic to affect (30% = 30 out of 100 requests)
Does NOT trigger retries = Bypasses retry policies (happens at proxy level)
Only in VirtualService = Gateway API doesn't support this feature yet
Use for: Testing error handling, timeout handling, resilience testing, chaos engineering
Remember: Always remove after testing - don't leave enabled in production
Advanced Routing
What is Advanced Routing?
Advanced routing = Route traffic based on request details (not just weights).
Beyond simple routing: Instead of just "70% to v1, 30% to v2", route based on URL, headers, methods, etc.
Analogy: Smart traffic cop that checks license plates, not just counts cars.
What You Can Match On
| Property | What It Matches | Example |
|---|---|---|
| uri | Request URL path | /api/v1/users |
| schema | Protocol | http, https |
| method | HTTP method | GET, POST, DELETE |
| authority | Host header | api.example.com |
| headers | Request headers | user-agent: Firefox |
Important: If you match on headers, other properties (uri, schema, method, authority) are ignored!
Three Ways to Match
1. Exact Match
Must match exactly
uri:
  exact: "/api/v1"
Matches: /api/v1 only
Doesn't match: /api/v1/users, /api/v2
2. Prefix Match
Matches beginning of string
uri:
  prefix: "/api"
Matches: /api, /api/v1, /api/v1/users
Doesn't match: /users/api
3. Regex Match
Pattern matching
headers:
  user-agent:
    regex: ".*Firefox.*"
Matches: Any user-agent containing "Firefox"
Example 1: Route by URL Path
http:
- match:
  - uri:
      prefix: /v1
  route:
  - destination:
      host: customers.default.svc.cluster.local
      subset: v1
What this does: All requests to /v1/* go to v1 subset
Example 2: Route by Header
http:
- match:
  - headers:
      user-agent:
        regex: '.*Firefox.*'
  route:
  - destination:
      host: customers.default.svc.cluster.local
      subset: v2
What this does: Firefox users go to v2, others go elsewhere
Rewriting Requests
Problem: Your service moved from /v1/api to /v2/api, but clients still call /v1/api
Solution: Rewrite the URL before forwarding
http:
- match:
  - uri:
      prefix: /v1/api
  rewrite:
    uri: /v2/api
  route:
  - destination:
      host: customers.default.svc.cluster.local
What this does:
- Client calls:
/v1/api/users - Envoy rewrites to:
/v2/api/users - Service receives:
/v2/api/users
Use for: API versioning, backward compatibility
Redirecting Requests
Different from rewrite: Sends HTTP redirect response to client
http:
- match:
  - headers:
      my-header:
        exact: hello
  redirect:
    uri: /hello
    authority: my-service.default.svc.cluster.local:8000
What this does: Client gets HTTP 301/302 redirect to new location
Important: redirect and destination are mutually exclusive (use one or the other, not both)
AND vs OR Logic
AND Logic (All conditions must match)
http:
- match:
  - uri:
      prefix: /v1
    headers:
      my-header:
        exact: hello
Matches when: URI starts with /v1 AND header my-header equals hello
OR Logic (Any condition can match)
http:
- match:
  - uri:
      prefix: /v1
- match:
  - headers:
      my-header:
        exact: hello
Matches when: URI starts with /v1 OR header my-header equals hello
How it works: Tries first match, if fails, tries second match, etc.
Real-World Examples
Example 1: Mobile vs Desktop
http:
- match:
  - headers:
      user-agent:
        regex: ".*Mobile.*"
  route:
  - destination:
      host: mobile-api.default.svc.cluster.local
- match:
  - headers:
      user-agent:
        regex: ".*Desktop.*"
  route:
  - destination:
      host: desktop-api.default.svc.cluster.local
Use case: Different API for mobile and desktop users
Example 2: API Versioning
http:
- match:
  - uri:
      prefix: /api/v2
  route:
  - destination:
      host: api.default.svc.cluster.local
      subset: v2
- match:
  - uri:
      prefix: /api/v1
  route:
  - destination:
      host: api.default.svc.cluster.local
      subset: v1
Use case: Route to different versions based on URL
Example 3: Beta Users
http:
- match:
  - headers:
      x-beta-user:
        exact: "true"
  route:
  - destination:
      host: app.default.svc.cluster.local
      subset: beta
- route:
  - destination:
      host: app.default.svc.cluster.local
      subset: stable
Use case: Beta users get new features, others get stable version
Gateway API (HTTPRoute)
Modern alternative to VirtualService
apiVersion: gateway.networking.k8s.io/v1
kind: HTTPRoute
metadata:
  name: customers-route
spec:
  parentRefs:
  - name: my-gateway
  rules:
  - matches:
    - path:
        type: PathPrefix
        value: /v1
    - headers:
      - name: user-agent
        value: Firefox
        type: RegularExpression
    backendRefs:
    - name: customers-service
      port: 8080
Same functionality: Match on path and headers, route to service
Difference: Kubernetes standard (not Istio-specific)
Configuration Comparison
| Feature | VirtualService | HTTPRoute (Gateway API) |
|---|---|---|
| Match URI | uri: prefix: /v1 | path: type: PathPrefix, value: /v1 |
| Match Header | headers: name: exact: value | headers: name: name, value: value |
| Rewrite | rewrite: uri: /v2 | Similar support |
| Redirect | redirect: uri: /new | Similar support |
| Complexity | More features | Simpler syntax |
| Standard | Istio-specific | Kubernetes standard |
Best Practices
Route Ordering:
- Put most specific matches first
- General patterns should come last
- Test route precedence carefully
# ✅ Good - specific first
- match:
  - uri:
      exact: /api/v1/admin
- match:
  - uri:
      prefix: /api/v1

# ❌ Bad - general first (admin never reached)
- match:
  - uri:
      prefix: /api/v1
- match:
  - uri:
      exact: /api/v1/admin
Pattern Matching:
- Use
prefixfor flexibility:/apimatches/api/v1,/api/v2, etc. - Use
exactfor specific endpoints:/health,/metrics - Test regex patterns carefully - wrong regex can break routing
Documentation:
- Document complex routing logic
- Include examples of expected behavior
- Maintain routing decision trees for complex scenarios
Advanced Routing Patterns
| Pattern | Use Case | Implementation |
|---|---|---|
| Feature Flags | Beta users get new features | Header-based routing |
| API Versioning | Multiple API versions | URI prefix matching |
| Device Targeting | Mobile vs Desktop | User-Agent header matching |
| Geographic Routing | Region-specific services | Custom header routing |
| Canary Testing | Gradual feature rollout | Percentage + header combination |
Advanced routing = Route based on request details (URL, headers, method, etc.)
Match types = Exact (precise), Prefix (starts with), Regex (pattern)
Rewrite = Change URL before forwarding (transparent to client)
Redirect = Send client to new location (client sees HTTP redirect)
AND logic = All conditions in one match block must be true
OR logic = Multiple match blocks (first match wins)
Gateway API = Modern Kubernetes standard (recommended for new projects)
Use for: API versioning, A/B testing, canary deployments, device targeting, feature flags
ServiceEntry
What is ServiceEntry?
ServiceEntry = Add external services to Istio's service registry. Makes external services look like they're part of your mesh.
Why needed: Apply Istio features (routing, retries, timeouts) to external services.
Like: Adding external contacts to your phone book so you can use speed dial.
What You Can Do With ServiceEntry
Once external service is in registry:
- Route traffic to it
- Apply retry policies
- Set timeouts
- Inject failures (for testing)
- Monitor with metrics
All the same features as internal services!
Basic Example: External API
apiVersion: networking.istio.io/v1
kind: ServiceEntry
metadata:
  name: external-svc
spec:
  hosts:
  - api.external-svc.com
  ports:
  - number: 443
    name: https
    protocol: TLS
  resolution: DNS
  location: MESH_EXTERNAL
What this does: Adds api.external-svc.com to service registry
Now you can: Apply VirtualService, DestinationRule to this external API
Key Fields
hosts
What it is: External service hostname(s)
Can be: Single or multiple hosts
Example: api.external-svc.com, *.google.com
ports
What it is: Which ports the service uses
Example:
ports:
- number: 443
  name: https
  protocol: TLS
resolution
How to find service IP:
- DNS: Dynamic DNS lookup (IP can change)
- STATIC: Fixed IP addresses (IP never changes)
When to use:
DNS→ Cloud services, APIs (IPs change)STATIC→ On-premise servers (fixed IPs)
location
Where service is:
- MESH_EXTERNAL: Outside the mesh (external APIs)
- MESH_INTERNAL: Inside the mesh (VMs, other clusters)
Important: Controls if mTLS is used automatically
How Envoy Checks Hosts
When multiple hosts defined, Envoy checks in this order:
- HTTP Authority/Host header (HTTP/1.1, HTTP/2)
- SNI (Server Name Indication for TLS)
- IP address and port
If none can be inspected → Either forward blindly or drop (depends on config)
exportTo Field
What it does: Control which namespaces can see this ServiceEntry
Options:
*(default): All namespaces can see it.: Only same namespace["namespace1", "namespace2"]: Specific namespaces
Example:
spec:
  exportTo:
  - "."  # Only this namespace
VM Integration (WorkloadEntry)
Use case: Migrate VMs to Kubernetes gradually
How it works: Register VMs as workloads in Istio
Step 1: Define WorkloadEntry for VMs
apiVersion: networking.istio.io/v1
kind: WorkloadEntry
metadata:
  name: customers-vm-1
spec:
  serviceAccount: customers
  address: 1.0.0.0
  labels:
    app: customers
    instance-id: vm1
---
apiVersion: networking.istio.io/v1
kind: WorkloadEntry
metadata:
  name: customers-vm-2
spec:
  serviceAccount: customers
  address: 2.0.0.0
  labels:
    app: customers
    instance-id: vm2
What this does: Registers 2 VMs with IPs 1.0.0.0 and 2.0.0.0
Step 2: Create ServiceEntry with workloadSelector
apiVersion: networking.istio.io/v1
kind: ServiceEntry
metadata:
  name: customers-svc
spec:
  hosts:
  - customers.com
  location: MESH_INTERNAL
  ports:
  - number: 80
    name: http
    protocol: HTTP
  resolution: STATIC
  workloadSelector:
    labels:
      app: customers
What this does:
- Includes VMs AND Kubernetes pods with label
app: customers - Load balances across both VMs and pods
- Treats VMs as part of mesh
MESH_INTERNAL vs MESH_EXTERNAL
| Feature | MESH_INTERNAL | MESH_EXTERNAL |
|---|---|---|
| Use for | VMs, other clusters | External APIs |
| mTLS | Yes (automatic) | No |
| Part of mesh | Yes | No |
| Example | VM workloads | api.stripe.com |
Real-World Examples
Example 1: External Payment API
apiVersion: networking.istio.io/v1
kind: ServiceEntry
metadata:
  name: stripe-api
spec:
  hosts:
  - api.stripe.com
  ports:
  - number: 443
    name: https
    protocol: TLS
  resolution: DNS
  location: MESH_EXTERNAL
Use case: Apply retry policies to Stripe API calls
Example 2: Database on VM
apiVersion: networking.istio.io/v1
kind: ServiceEntry
metadata:
  name: postgres-vm
spec:
  hosts:
  - postgres.internal
  ports:
  - number: 5432
    name: postgres
    protocol: TCP
  resolution: STATIC
  location: MESH_INTERNAL
  endpoints:
  - address: 10.0.0.50
Use case: Include VM database in mesh, apply mTLS
Example 3: Multiple External APIs
apiVersion: networking.istio.io/v1
kind: ServiceEntry
metadata:
  name: google-apis
spec:
  hosts:
  - "*.googleapis.com"
  ports:
  - number: 443
    name: https
    protocol: TLS
  resolution: DNS
  location: MESH_EXTERNAL
Use case: All Google APIs accessible through mesh
Important Note: Global vs Namespace Config
Global config (in istio-system namespace):
- Applies to ALL namespaces
- Acts as default
Namespace-specific config:
- Overrides global config
- Only applies to that namespace
Example: ServiceEntry in istio-system → Available everywhere (unless exportTo restricts it)
Configuration Reference
| Field | Purpose | Example Values |
|---|---|---|
| hosts | Service hostname | api.example.com |
| ports | Service ports | 443, 80, 5432 |
| resolution | How to find IP | DNS, STATIC |
| location | Where service is | MESH_EXTERNAL, MESH_INTERNAL |
| exportTo | Visibility | *, ., ["ns1"] |
| workloadSelector | Select VMs/pods | app: customers |
Best Practices
External Services:
- Use
MESH_EXTERNALfor third-party APIs - Set appropriate
exportToto limit visibility - Monitor external service dependencies
VM Integration:
- Use
MESH_INTERNALfor VMs joining the mesh - Implement proper service accounts for VMs
- Plan gradual migration from VMs to containers
Resolution Strategy:
- Use
DNSfor cloud services (IPs change) - Use
STATICfor on-premise services (fixed IPs) - Consider load balancing implications
ServiceEntry Field Reference
| Field | Purpose | Example Values | Use Case |
|---|---|---|---|
| hosts | Service hostname | api.example.com | External API |
| ports | Service ports | 443, 80, 5432 | Protocol definition |
| resolution | IP discovery method | DNS, STATIC | Cloud vs on-premise |
| location | Service location | MESH_EXTERNAL, MESH_INTERNAL | Security boundary |
| exportTo | Visibility scope | *, ., ["ns1"] | Access control |
| workloadSelector | VM/pod selection | app: customers | Hybrid deployments |
ServiceEntry = Add external services to Istio's service registry
MESH_EXTERNAL = External APIs (no automatic mTLS)
MESH_INTERNAL = VMs, other clusters (with automatic mTLS)
WorkloadEntry = Register individual VMs as mesh workloads
Resolution DNS = Dynamic IPs for cloud services
Resolution STATIC = Fixed IPs for on-premise services
exportTo = Control which namespaces can see the service
Use for: External API management, VM migration, multi-cluster setups, hybrid deployments
Sidecar Resource
What is Sidecar Resource?
Sidecar resource = Control what kind of configuration each proxy receives. Limits scope to improve performance.
Problem it solves: By default, Istio pushes ALL config to ALL proxies. In large clusters, this wastes resources.
Solution: Tell each proxy to only care about services it actually talks to.
Like: Only getting news about your city, not the whole world.
Why Use It?
Default behavior:
- Any change anywhere → Config pushed to ALL proxies
- Large clusters → Lots of unnecessary updates
- Wastes memory and CPU
With Sidecar resource:
- Only relevant config pushed to each proxy
- Better performance
- Less memory usage
- Faster updates
Important Note
Sidecar resource does NOT enforce security!
It only controls:
- What config proxy receives
- What services proxy knows about
It does NOT control:
- What traffic is allowed
- Security policies
Basic Example: Limit Namespace Scope
apiVersion: networking.istio.io/v1
kind: Sidecar
metadata:
  name: default
  namespace: foo
spec:
  egress:
  - hosts:
    - "./*"              # Services in same namespace (foo)
    - "istio-system/*"   # Services in istio-system
What this does:
- Workloads in
foonamespace only see:- Services in
foonamespace - Services in
istio-systemnamespace
- Services in
- Changes in
barnamespace → No config update tofooworkloads
Result: Less config, better performance
Host Format
Pattern: namespace/service
Examples:
./*→ All services in same namespaceistio-system/*→ All services in istio-systemdefault/customers→ Specific service*/*→ All services in all namespaces (default behavior)
Workload Selector
Default: Sidecar applies to ALL workloads in namespace
With selector: Apply to specific workloads only
apiVersion: networking.istio.io/v1
kind: Sidecar
metadata:
  name: versioned-sidecar
  namespace: default
spec:
  workloadSelector:
    labels:
      version: v1
  egress:
  - hosts:
    - "default/*"
    - "istio-system/*"
What this does: Only applies to pods with label version: v1
Use case: Different config for different versions
Ingress Listener (Inbound Traffic)
What it does: Control how proxy receives incoming traffic
apiVersion: networking.istio.io/v1
kind: Sidecar
metadata:
  name: ingress-sidecar
  namespace: default
spec:
  ingress:
  - port:
      number: 3000
      protocol: HTTP
      name: somename
    defaultEndpoint: 127.0.0.1:8080
What this does:
- Listen on port 3000
- Forward traffic to 127.0.0.1:8080 (your app)
Use case: Custom port mapping
Egress Listener (Outbound Traffic)
What it does: Control what external services proxy can access
apiVersion: networking.istio.io/v1
kind: Sidecar
metadata:
  name: egress-sidecar
  namespace: default
spec:
  egress:
  - port:
      number: 8080
      protocol: HTTP
    hosts:
    - "staging/*"
What this does:
- Only allow outbound traffic on port 8080
- Only to services in
stagingnamespace
Use case: Restrict what services can talk to
Real-World Examples
Example 1: Microservice Only Talks to Database
apiVersion: networking.istio.io/v1
kind: Sidecar
metadata:
  name: api-sidecar
  namespace: production
spec:
  workloadSelector:
    labels:
      app: api
  egress:
  - hosts:
    - "production/database"
    - "istio-system/*"
Use case: API service only needs to know about database
Example 2: Frontend Only Talks to Backend
apiVersion: networking.istio.io/v1
kind: Sidecar
metadata:
  name: frontend-sidecar
  namespace: default
spec:
  workloadSelector:
    labels:
      app: frontend
  egress:
  - hosts:
    - "default/backend"
    - "default/auth"
Use case: Frontend only talks to backend and auth services
Example 3: Namespace Isolation
apiVersion: networking.istio.io/v1
kind: Sidecar
metadata:
  name: default
  namespace: team-a
spec:
  egress:
  - hosts:
    - "./*"              # Only team-a services
    - "shared/*"         # Shared services
    - "istio-system/*"   # Istio services
Use case: Team A can't see Team B services
Best Practices
Use in Large Clusters:
- 100+ services → Definitely use Sidecar resource
- Reduces memory and CPU usage
Start with Namespace Scope:
egress:
- hosts:
  - "./*"
  - "istio-system/*"
Most common pattern
Add Specific Services as Needed:
egress:
- hosts:
  - "./*"
  - "production/database"
  - "istio-system/*"
4. Use Workload Selectors for Fine Control Different configs for different workloads
5. Monitor Impact Check if performance improves after applying
Common Patterns
Pattern 1: Same Namespace Only
egress:
- hosts:
  - "./*"
  - "istio-system/*"
When: Services only talk within namespace
Pattern 2: Cross-Namespace Communication
egress:
- hosts:
  - "./*"
  - "other-namespace/*"
  - "istio-system/*"
When: Need to talk to specific other namespace
Pattern 3: Specific Services Only
egress:
- hosts:
  - "default/service-a"
  - "default/service-b"
  - "istio-system/*"
When: Only talk to 2-3 specific services
Quick Reference
| Field | Purpose | Example |
|---|---|---|
| egress.hosts | What services proxy can see | ./*, default/* |
| ingress.port | Inbound port config | 3000 |
| workloadSelector | Which pods this applies to | app: frontend |
| defaultEndpoint | Where to forward traffic | 127.0.0.1:8080 |
Key Takeaway
Sidecar resource = Limit what config each proxy receives
Default = All proxies get all config (wasteful)
With Sidecar = Each proxy only gets relevant config (efficient)
Does NOT enforce security = Only controls config scope
Egress hosts = What services proxy knows about
Workload selector = Apply to specific pods
Best for = Large clusters (100+ services)
Use for: Performance optimization, reducing memory usage, faster config updates
Performance Impact
| Cluster Size | Without Sidecar Resource | With Sidecar Resource | Improvement |
|---|---|---|---|
| 50 services | Minimal impact | Slight improvement | 10-15% |
| 100 services | Noticeable overhead | Moderate improvement | 25-40% |
| 500+ services | Significant overhead | Major improvement | 50-70% |
Use Workload Selectors for Fine Control:
- Different configs for different workloads
Monitor Impact:
- Check if performance improves after applying
Common Patterns
Pattern 1: Same Namespace Only
egress:
- hosts:
  - "./*"
  - "istio-system/*"
When: Services only talk within namespace
Pattern 2: Cross-Namespace Communication
egress:
- hosts:
  - "./*"
  - "other-namespace/*"
  - "istio-system/*"
When: Need to talk to specific other namespace
Pattern 3: Specific Services Only
egress:
- hosts:
  - "default/service-a"
  - "default/service-b"
  - "istio-system/*"
When: Only talk to 2-3 specific services
Quick Reference
| Field | Purpose | Example |
|---|---|---|
| egress.hosts | What services proxy can see | ./*, default/* |
| ingress.port | Inbound port config | 3000 |
| workloadSelector | Which pods this applies to | app: frontend |
| defaultEndpoint | Where to forward traffic | 127.0.0.1:8080 |
Key Takeaway
Sidecar resource = Limit what config each proxy receives
Default = All proxies get all config (wasteful)
With Sidecar = Each proxy only gets relevant config (efficient)
Does NOT enforce security = Only controls config scope
Egress hosts = What services proxy knows about
Workload selector = Apply to specific pods
Best for = Large clusters (100+ services)
Use for: Performance optimization, reducing memory usage, faster config updates
Sidecar Resource Reference
| Field | Purpose | Example | Impact |
|---|---|---|---|
| egress.hosts | Services proxy can see | ./*, default/* | Memory usage |
| ingress.port | Inbound port config | 3000 | Port mapping |
| workloadSelector | Target specific pods | app: frontend | Granular control |
| defaultEndpoint | Traffic forwarding | 127.0.0.1:8080 | Custom routing |
Sidecar resource does NOT enforce security!
It only controls:
- What configuration each proxy receives
- What services proxy knows about
It does NOT control:
- What traffic is actually allowed
- Security policies or access control
Sidecar resource = Optimize proxy configuration scope for better performance
Default behavior = All proxies get all config (wasteful in large clusters)
With Sidecar = Each proxy only gets relevant config (efficient)
Does NOT enforce security = Only controls configuration scope
Egress hosts = Define which services proxy knows about
Workload selector = Apply configuration to specific pods
Best for = Large clusters (100+ services) with performance concerns
Use for: Performance optimization, reducing memory usage, faster config updates
EnvoyFilter
What is EnvoyFilter?
EnvoyFilter = Customize Envoy proxy configuration directly. Low-level control over proxy behavior.
Power: Can modify anything in Envoy config
Danger: Wrong config can break entire mesh!
Like: Editing engine code directly - powerful but risky
When to Use EnvoyFilter
Use when:
- Istio doesn't provide the feature you need
- Need very specific custom behavior
- Adding custom headers
- Injecting Lua or WASM filters
Don't use when:
- Istio already has the feature (use VirtualService, DestinationRule instead)
- You're not sure what you're doing
- In production without testing
Important Warnings
⚠️ Can break your mesh if configured wrong
⚠️ Always test in staging first
⚠️ Use minimal changes - don't modify more than needed
⚠️ Requires Envoy knowledge - understand Envoy proxy first
How It Works
Application order:
- Filters in
istio-systemnamespace (global) applied first - Then filters in workload's namespace
- Applied incrementally (one after another)
Scope:
istio-systemnamespace → Affects entire mesh- Workload namespace → Affects only that namespace
Example: Add Custom Header to Response
apiVersion: networking.istio.io/v1
kind: EnvoyFilter
metadata:
  name: api-header-filter
  namespace: default
spec:
  workloadSelector:
    labels:
      app: web-frontend
  configPatches:
  - applyTo: HTTP_FILTER
    match:
      context: SIDECAR_INBOUND
      listener:
        portNumber: 8080
        filterChain:
          filter:
            name: "envoy.filters.network.http_connection_manager"
            subFilter:
              name: "envoy.filters.http.router"
    patch:
      operation: INSERT_BEFORE
      value:
        name: envoy.filters.http.lua
        typed_config:
          "@type": "type.googleapis.com/envoy.extensions.filters.http.lua.v3.Lua"
          inlineCode: |
            function envoy_on_response(response_handle)
              response_handle:headers():add("api-version", "v1")
            end
What this does:
- Applies to workloads with label
app: web-frontend - Adds header
api-version: v1to all responses - Uses Lua script to modify response
Test it:
curl -I http://your-service
# Should see: api-version: v1
Key Fields
workloadSelector
What it does: Which workloads this filter applies to
Example: app: web-frontend
configPatches
What it does: List of modifications to make
Contains: Match criteria + patch operation
applyTo
What to modify: HTTP_FILTER, LISTENER, CLUSTER, ROUTE, etc.
match
Where to apply: Context (SIDECAR_INBOUND, SIDECAR_OUTBOUND, GATEWAY)
patch.operation
How to modify:
INSERT_BEFORE- Add before existing filterINSERT_AFTER- Add after existing filterREPLACE- Replace existing filterREMOVE- Remove filterMERGE- Merge with existing
Common Use Cases
1. Adding/Modifying Headers
Add custom headers for tracing, debugging, monitoring
Example: Add request ID, version info, debug flags
2. Custom Lua Filters
Run custom Lua code to process requests/responses
Example: Custom authentication, request transformation
3. WASM Filters
Inject WebAssembly filters for specialized processing
Example: Custom rate limiting, data transformation
4. Override Istio Defaults
Change Istio's default Envoy config for specific workloads
Example: Custom timeout values, buffer sizes
5. Advanced Rate Limiting
Implement complex rate limiting beyond Istio's built-in features
Best Practices
Minimal Changes:
- Only modify what you absolutely need
Test in Staging:
- NEVER apply untested EnvoyFilter in production
Namespace Scoping:
- Global changes →
istio-systemnamespace - Specific workloads → Workload namespace
Document Everything:
- Write comments explaining what and why
Have Rollback Plan:
- Know how to quickly remove filter if things break
Monitor After Applying:
- Watch metrics, logs for issues
Configuration Reference
| Field | Purpose | Example |
|---|---|---|
| workloadSelector | Which pods | app: frontend |
| applyTo | What to modify | HTTP_FILTER, LISTENER |
| match.context | Where to apply | SIDECAR_INBOUND, GATEWAY |
| patch.operation | How to modify | INSERT_BEFORE, REPLACE |
Safety Guidelines
NEVER apply untested EnvoyFilter in production!
Required steps:
- Test in development environment first
- Validate in staging with production-like traffic
- Have immediate rollback plan ready
- Monitor metrics closely after deployment
- Start with single workload, then expand gradually
EnvoyFilter Risk Assessment
| Risk Level | Scope | Impact | Mitigation |
|---|---|---|---|
| High | istio-system namespace | Entire mesh | Extensive testing, gradual rollout |
| Medium | Workload namespace | Specific services | Thorough testing, monitoring |
| Low | Single workload | Individual pods | Basic testing, easy rollback |
EnvoyFilter Field Reference
| Field | Purpose | Example | Risk Level |
|---|---|---|---|
| workloadSelector | Target specific pods | app: frontend | Medium |
| applyTo | What to modify | HTTP_FILTER, LISTENER | High |
| match.context | Where to apply | SIDECAR_INBOUND, GATEWAY | High |
| patch.operation | How to modify | INSERT_BEFORE, REPLACE | Very High |
Alternative Solutions
Before using EnvoyFilter, consider these safer alternatives:
| Need | EnvoyFilter | Safer Alternative |
|---|---|---|
| Traffic routing | Complex patches | VirtualService |
| Load balancing | Custom algorithms | DestinationRule |
| Timeouts/Retries | Connection settings | VirtualService |
| Security policies | Custom filters | AuthorizationPolicy |
| Rate limiting | Custom Lua/WASM | Istio rate limiting |
EnvoyFilter = Direct Envoy proxy customization (advanced and risky!)
Powerful = Can modify any Envoy configuration
Dangerous = Can break entire mesh if misconfigured
Use sparingly = Only when Istio built-in features aren't sufficient
Always test = Development → Staging → Production (never skip steps)
Requires expertise = Deep understanding of Envoy proxy architecture
Common uses = Custom headers, Lua filters, WASM extensions, advanced rate limiting
Scope matters = istio-system (global impact) vs namespace (local impact)
Last resort = Try VirtualService, DestinationRule, AuthorizationPolicy first
Lab 3: Gateways
What This Lab Covers
Deploy a Hello World application and expose it to external traffic using two approaches:
- Istio Gateway (Istio-native approach)
- Kubernetes Gateway API (Standard Kubernetes approach)
Prerequisites
- Istio installed (sidecar or ambient mode)
- kubectl configured
- Ingress gateway deployed
Option 1: Using Istio Gateway
Step 1: Create Gateway Resource
Purpose: Opens entry point for external traffic
apiVersion: networking.istio.io/v1
kind: Gateway
metadata:
  name: istio-gateway
spec:
  selector:
    istio: ingressgateway  # Uses istio-ingressgateway pod
  servers:
  - port:
      number: 80
      name: http
      protocol: HTTP
    hosts:
    - '*'  # Accepts traffic from any domain
Apply configuration:
kubectl apply -f istio-gateway.yaml
Get gateway external IP:
kubectl get svc -n istio-system istio-ingressgateway
Step 2: Deploy Hello World Application
Purpose: Deploy sample application to test gateway
# Deployment - runs the application
apiVersion: apps/v1
kind: Deployment
metadata:
  name: hello-world
spec:
  replicas: 1
  selector:
    matchLabels:
      app: hello-world
  template:
    metadata:
      labels:
        app: hello-world
    spec:
      containers:
      - image: gcr.io/tetratelabs/hello-world:1.0.0
        name: svc
        ports:
        - containerPort: 3000

---
# Service - exposes application inside cluster
apiVersion: v1
kind: Service
metadata:
  name: hello-world
spec:
  selector:
    app: hello-world
  ports:
  - port: 80
    targetPort: 3000
Apply configuration:
kubectl apply -f hello-world.yaml
Step 3: Create VirtualService
Purpose: Routes gateway traffic to application
apiVersion: networking.istio.io/v1
kind: VirtualService
metadata:
  name: hello-world
spec:
  hosts:
  - "*"  # Accepts any hostname
  gateways:
  - istio-gateway  # Binds to istio-gateway
  http:
  - route:
    - destination:
        host: hello-world.default.svc.cluster.local
        port:
          number: 80
Apply configuration:
kubectl apply -f vs-hello-world.yaml
Test the Application
For cloud clusters:
export GATEWAY_URL=$(kubectl get svc -n istio-system istio-ingressgateway -o jsonpath='{.status.loadBalancer.ingress[0].ip}')
curl -v http://$GATEWAY_URL/
For Minikube:
# Start tunnel in separate terminal
minikube tunnel

# Test application
curl -v http://localhost/
Expected output: Hello World application response
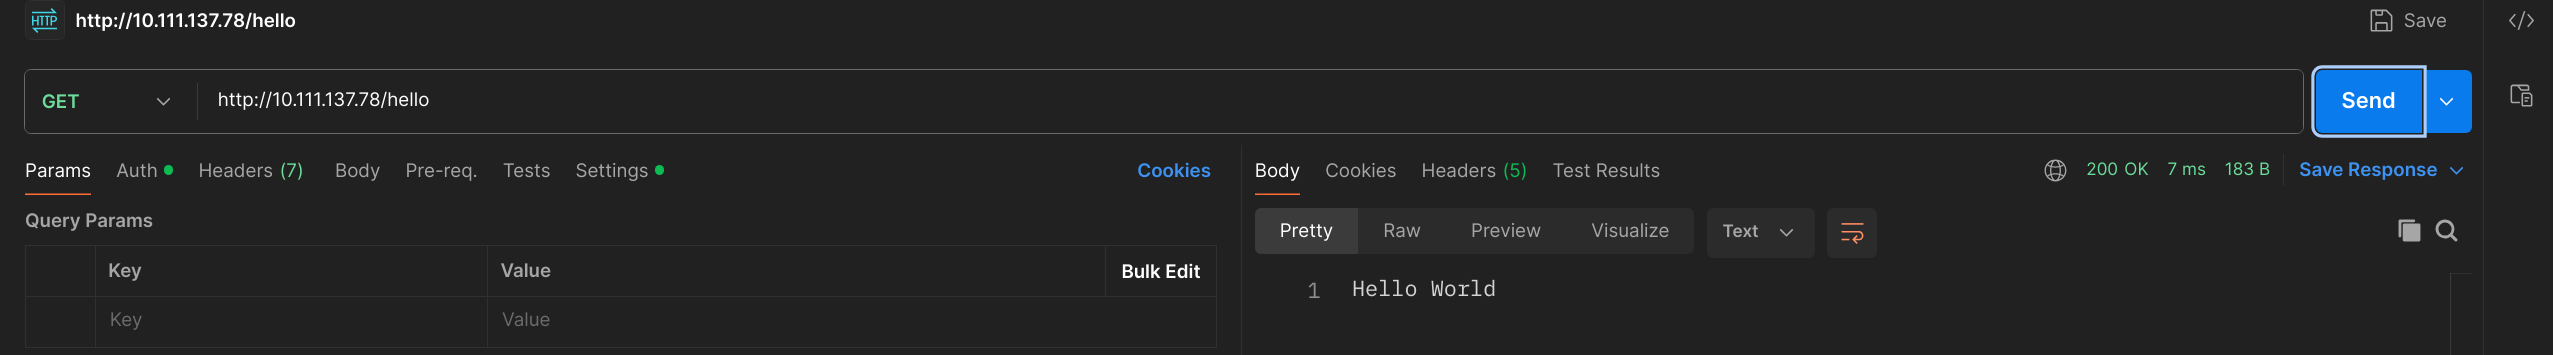
Option 2: Using Kubernetes Gateway API
Step 1: Create Gateway API Resource
Purpose: Uses Kubernetes standard Gateway API
apiVersion: gateway.networking.k8s.io/v1
kind: Gateway
metadata:
  name: http-gateway
spec:
  gatewayClassName: istio  # Uses Istio as implementation
  listeners:
  - name: http
    protocol: HTTP
    port: 80
    allowedRoutes:
      namespaces:
        from: All  # Allows routes from any namespace
Apply configuration:
kubectl apply -f gateway-api.yaml
Step 2: Create HTTPRoute
Purpose: Routes traffic to application (replaces VirtualService)
apiVersion: gateway.networking.k8s.io/v1
kind: HTTPRoute
metadata:
  name: hello-world-route
spec:
  parentRefs:
  - name: http-gateway  # Attaches to http-gateway
  rules:
  - matches:
    - path:
        type: PathPrefix
        value: /  # Matches all paths starting with /
    backendRefs:
    - name: hello-world  # Routes to hello-world service
      port: 80
Apply configuration:
kubectl apply -f http-route.yaml
Test the Application
For Minikube:
# Get gateway URL
minikube service http-gateway-istio --url

# Example output: http://127.0.0.1:12345

# Test application
curl -v http://127.0.0.1:12345/
Expected output: Hello World application response
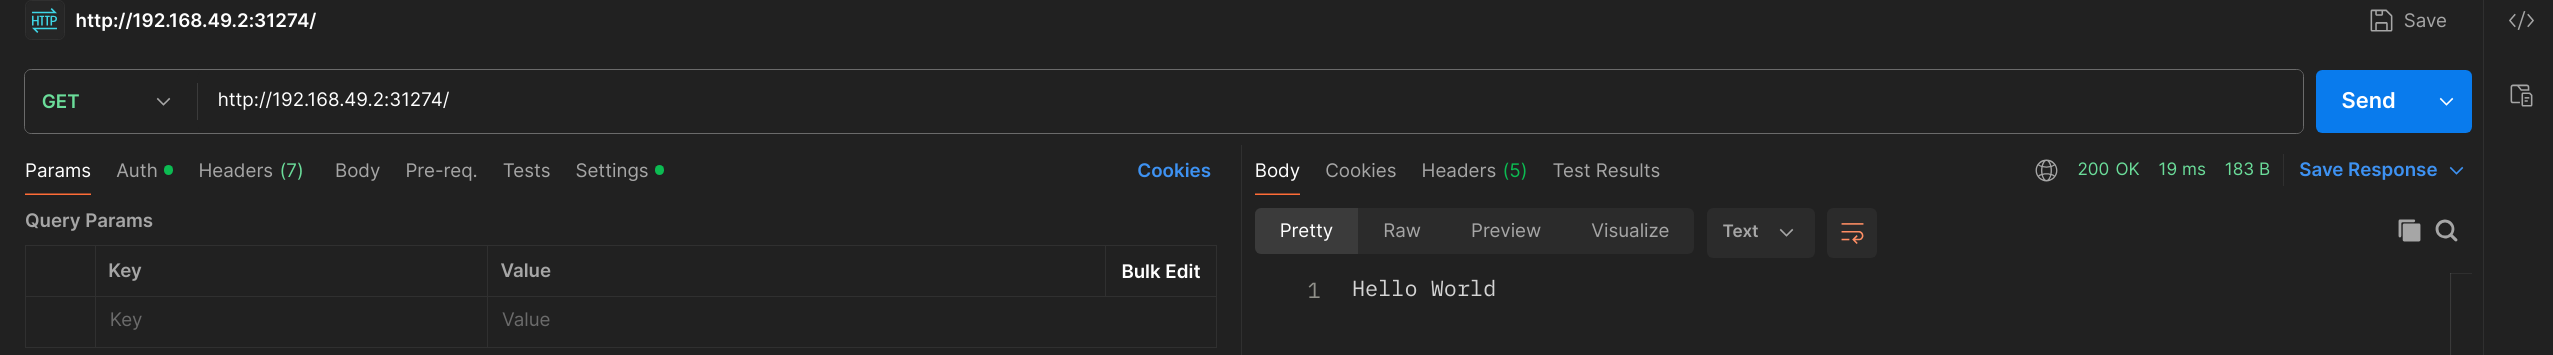
Cleanup
Remove all resources:
kubectl delete deploy hello-world
kubectl delete service hello-world
kubectl delete vs hello-world
kubectl delete gateway istio-gateway
kubectl delete gateway http-gateway
kubectl delete httproute hello-world-route
Comparison: Istio Gateway vs Kubernetes Gateway API
| Feature | Istio Gateway | Kubernetes Gateway API |
|---|---|---|
| Gateway resource | Istio Gateway | K8s Gateway (standard) |
| Routing resource | VirtualService | HTTPRoute |
| Maintainer | Istio project | Kubernetes project |
| Portability | Istio-specific | Works with any gateway |
| Maturity | Stable | Growing adoption |
| Features | Istio-specific features | Standard K8s features |
When to Use Each Approach
Use Istio Gateway When:
- Already using Istio extensively
- Need Istio-specific features
- Team has Istio expertise
- Existing infrastructure uses Istio Gateway
Use Kubernetes Gateway API When:
- Want Kubernetes-native approach
- Planning to switch gateway providers
- Starting new projects
- Need future-proof, portable solution
- Want vendor-neutral configuration
Gateway = Entry point for external traffic into the cluster
VirtualService (Istio) = Defines routing rules for Istio Gateway
HTTPRoute (K8s API) = Standard Kubernetes routing (replaces VirtualService)
hosts: "*" = Accepts traffic from any domain or IP
Minikube = Requires minikube tunnel for external access
Two approaches = Same functionality, different standards
Gateway API = Newer, more portable, Kubernetes-native standard
Both work = Choose based on your requirements and existing setup
Lab 4: Observing Failure Injection
What This Lab Covers
Deploy a web application with two services (web-frontend and customers), inject failures (delays and errors), and observe them using Grafana, Zipkin, and Kiali.
Purpose: Learn how to test application resilience and visualize failures in monitoring tools.
Prerequisites
- Istio installed with sidecar injection enabled
- Prometheus, Grafana, Zipkin, and Kiali installed
- kubectl configured
- Gateway deployed
Application Architecture
User → Gateway → Web Frontend → Customers Service
Services:
- web-frontend: Frontend application that calls customers service
- customers-v1: Backend service (target for failure injection)
Step 1: Deploy Gateway
Purpose: Creates entry point for external traffic
apiVersion: networking.istio.io/v1
kind: Gateway
metadata:
  name: gateway
spec:
  selector:
    istio: ingressgateway
  servers:
  - port:
      number: 80
      name: http
      protocol: HTTP
    hosts:
    - '*'
Apply configuration:
kubectl apply -f gateway.yaml
Step 2: Deploy Web Frontend
Purpose: Deploys frontend application that calls customers service
# Deployment
apiVersion: apps/v1
kind: Deployment
metadata:
  name: web-frontend
spec:
  replicas: 1
  selector:
    matchLabels:
      app: web-frontend
  template:
    metadata:
      labels:
        app: web-frontend
        version: v1
    spec:
      containers:
      - image: gcr.io/tetratelabs/web-frontend:1.0.0
        name: web
        ports:
        - containerPort: 8080
        env:
        - name: CUSTOMER_SERVICE_URL
          value: 'http://customers.default.svc.cluster.local'

---
# Service
apiVersion: v1
kind: Service
metadata:
  name: web-frontend
spec:
  selector:
    app: web-frontend
  ports:
  - port: 80
    targetPort: 8080

---
# VirtualService
apiVersion: networking.istio.io/v1
kind: VirtualService
metadata:
  name: web-frontend
spec:
  hosts:
  - '*'
  gateways:
  - gateway
  http:
  - route:
    - destination:
        host: web-frontend.default.svc.cluster.local
        port:
          number: 80
Apply configuration:
kubectl apply -f web-frontend.yaml
Step 3: Deploy Customers Service
Purpose: Deploys backend service for failure injection testing
# Deployment
apiVersion: apps/v1
kind: Deployment
metadata:
  name: customers-v1
spec:
  replicas: 1
  selector:
    matchLabels:
      app: customers
      version: v1
  template:
    metadata:
      labels:
        app: customers
        version: v1
    spec:
      containers:
      - image: gcr.io/tetratelabs/customers:1.0.0
        name: svc
        ports:
        - containerPort: 3000

---
# Service
apiVersion: v1
kind: Service
metadata:
  name: customers
spec:
  selector:
    app: customers
  ports:
  - port: 80
    targetPort: 3000

---
# DestinationRule (defines subsets)
apiVersion: networking.istio.io/v1
kind: DestinationRule
metadata:
  name: customers
spec:
  host: customers.default.svc.cluster.local
  subsets:
  - name: v1
    labels:
      version: v1

---
# VirtualService (routes traffic)
apiVersion: networking.istio.io/v1
kind: VirtualService
metadata:
  name: customers
spec:
  hosts:
  - 'customers.default.svc.cluster.local'
  http:
  - route:
    - destination:
        host: customers.default.svc.cluster.local
        port:
          number: 80
        subset: v1
Apply configuration:
kubectl apply -f customers.yaml
Test 1: Inject Delay (Simulate Slow Service)
Objective
Add a 5-second delay to 50% of requests to the customers service to simulate network latency or slow backend processing.
Update VirtualService
apiVersion: networking.istio.io/v1
kind: VirtualService
metadata:
  name: customers
spec:
  hosts:
  - 'customers.default.svc.cluster.local'
  http:
  - route:
    - destination:
        host: customers.default.svc.cluster.local
        port:
          number: 80
        subset: v1
    fault:
      delay:
        percentage:
          value: 50  # 50% of requests
        fixedDelay: 5s  # Wait 5 seconds
Apply configuration:
kubectl apply -f customers-delay.yaml
Generate Traffic
Get gateway URL:
kubectl get vs

export GATEWAY_URL=$(kubectl get svc -n istio-system istio-ingressgateway -o jsonpath='{.status.loadBalancer.ingress[0].ip}')
For Minikube:
minikube tunnel  # Run in separate terminal
export GATEWAY_URL=localhost
Send continuous requests:
while true; do curl http://$GATEWAY_URL/; sleep 1; done
Expected behavior: Approximately 50% of requests take 5+ seconds (delayed), while others respond quickly.
Observe Delay in Grafana
Open Grafana dashboard:
istioctl dashboard grafana
Navigation steps:
- Click Home → Istio Service Dashboard
- Select service:
customers.default.svc.cluster.local - Select reporter:
source - Expand Client Workloads panel
- Examine Client Request Duration graph
What to observe: Request duration spikes showing 5+ second delays for affected requests.
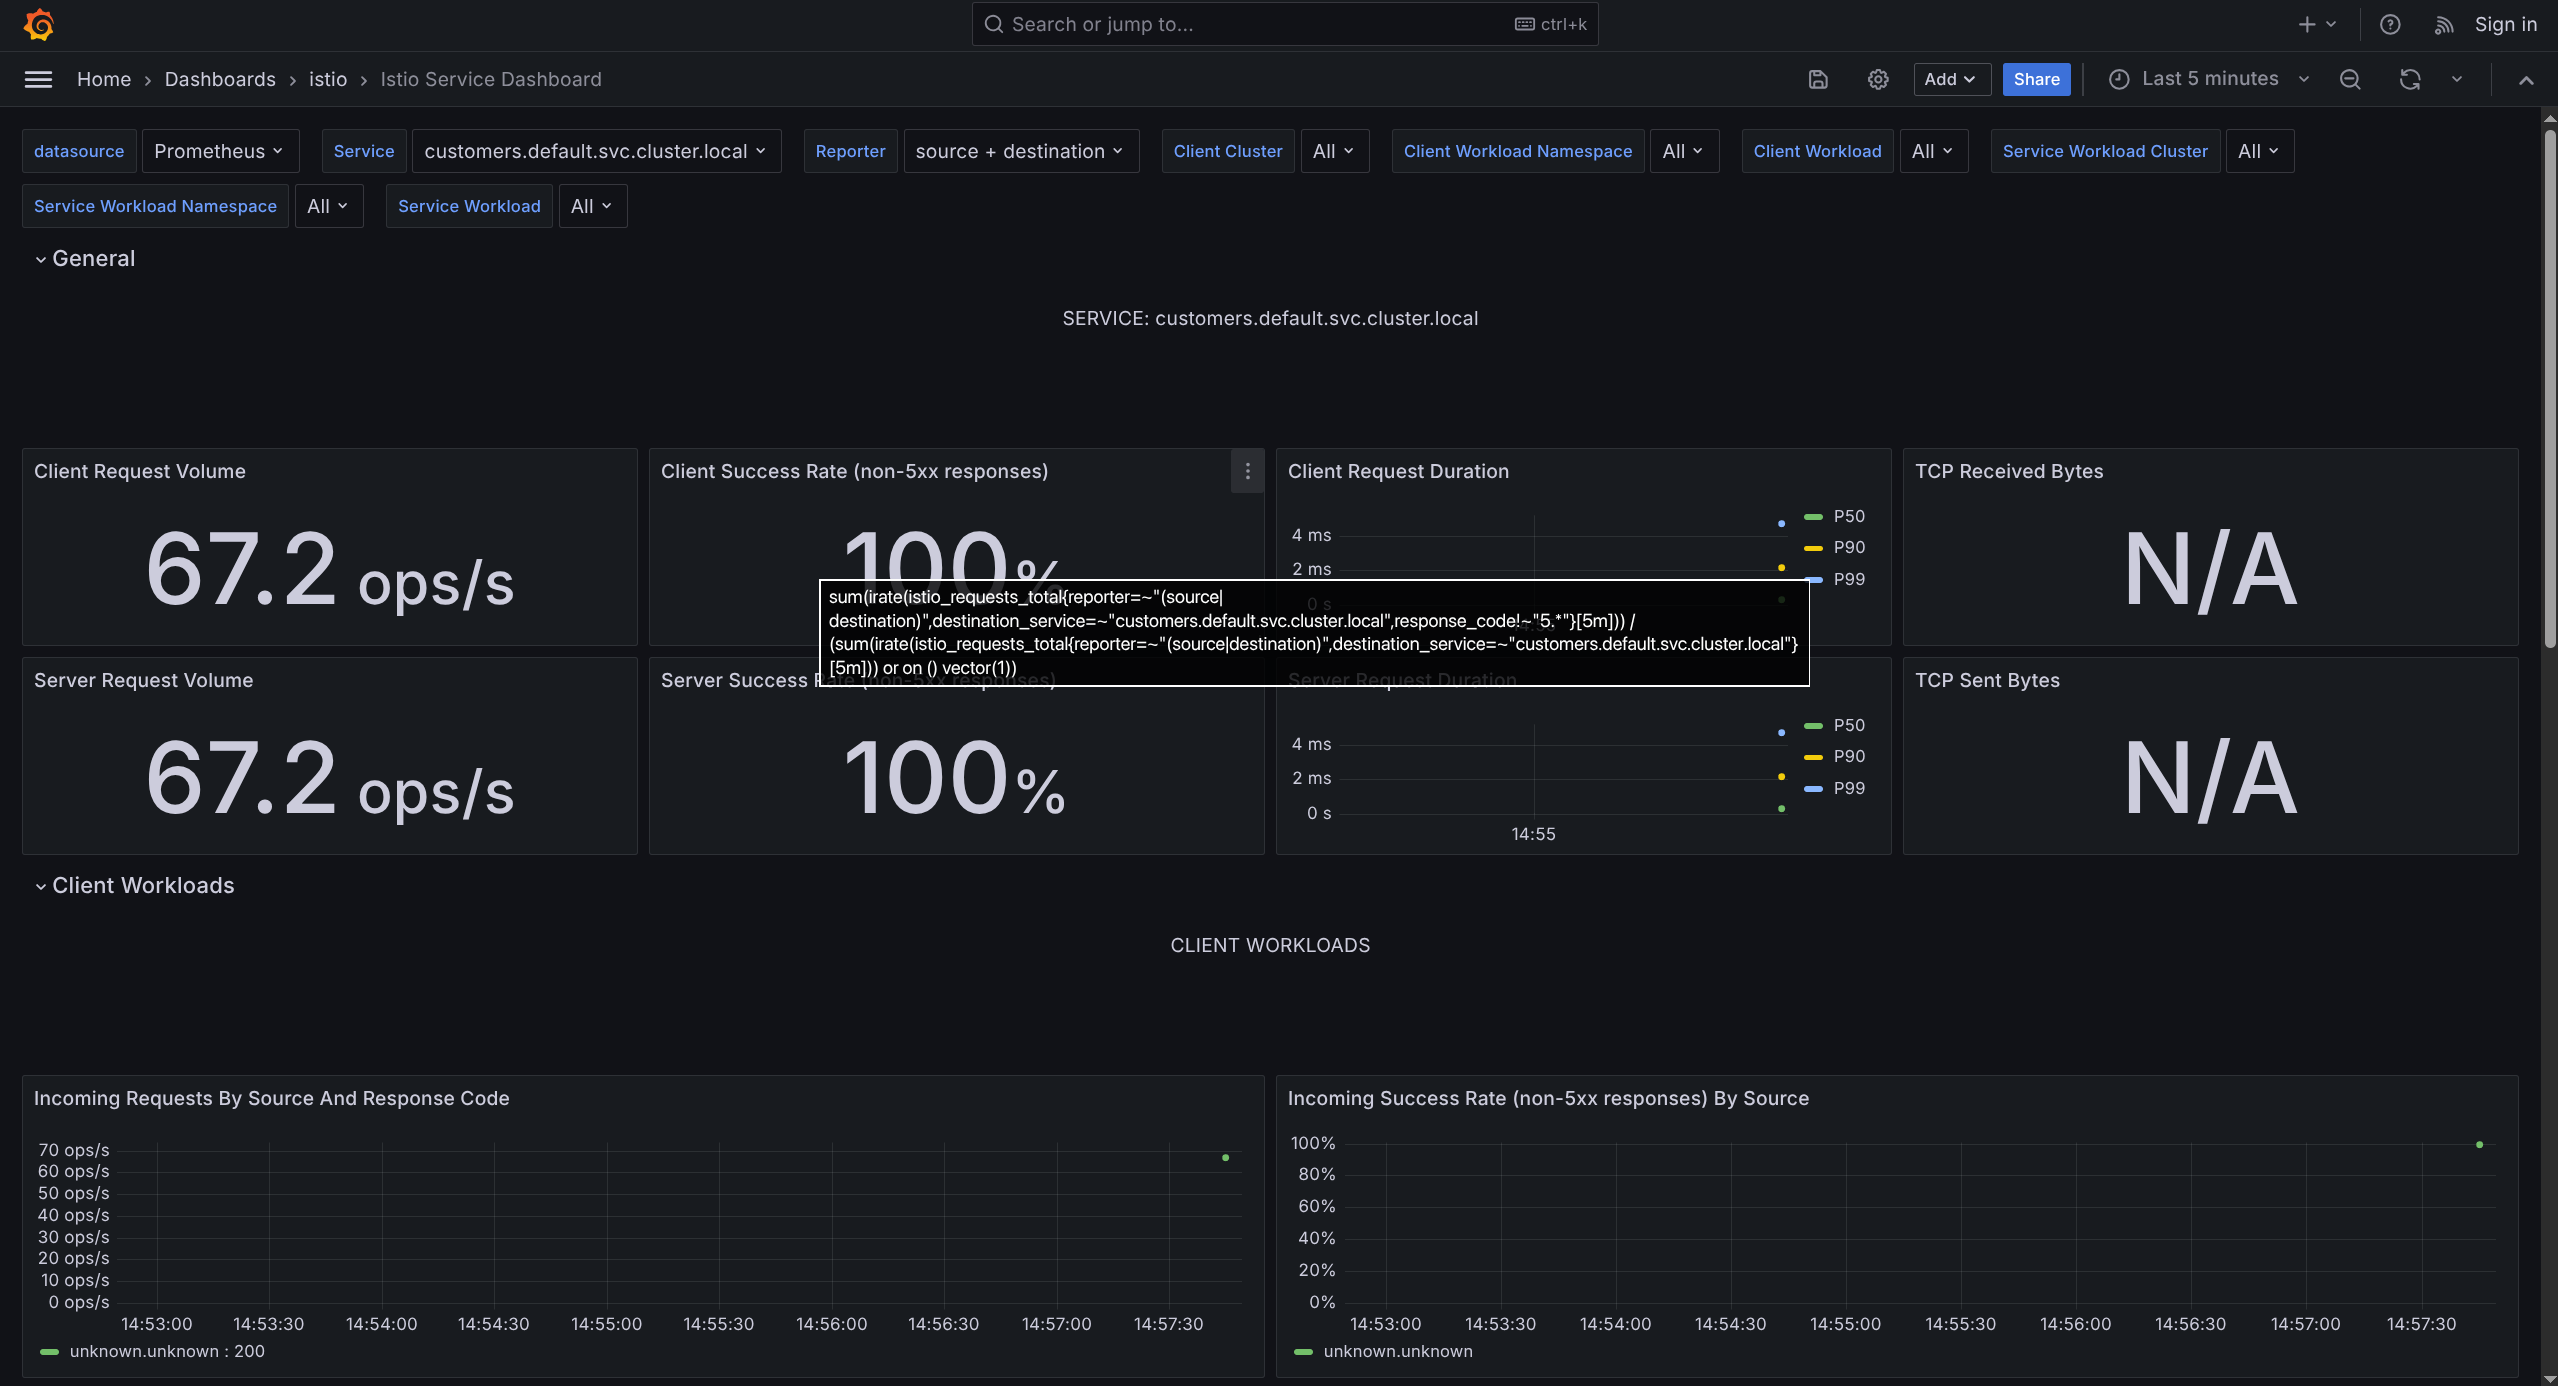
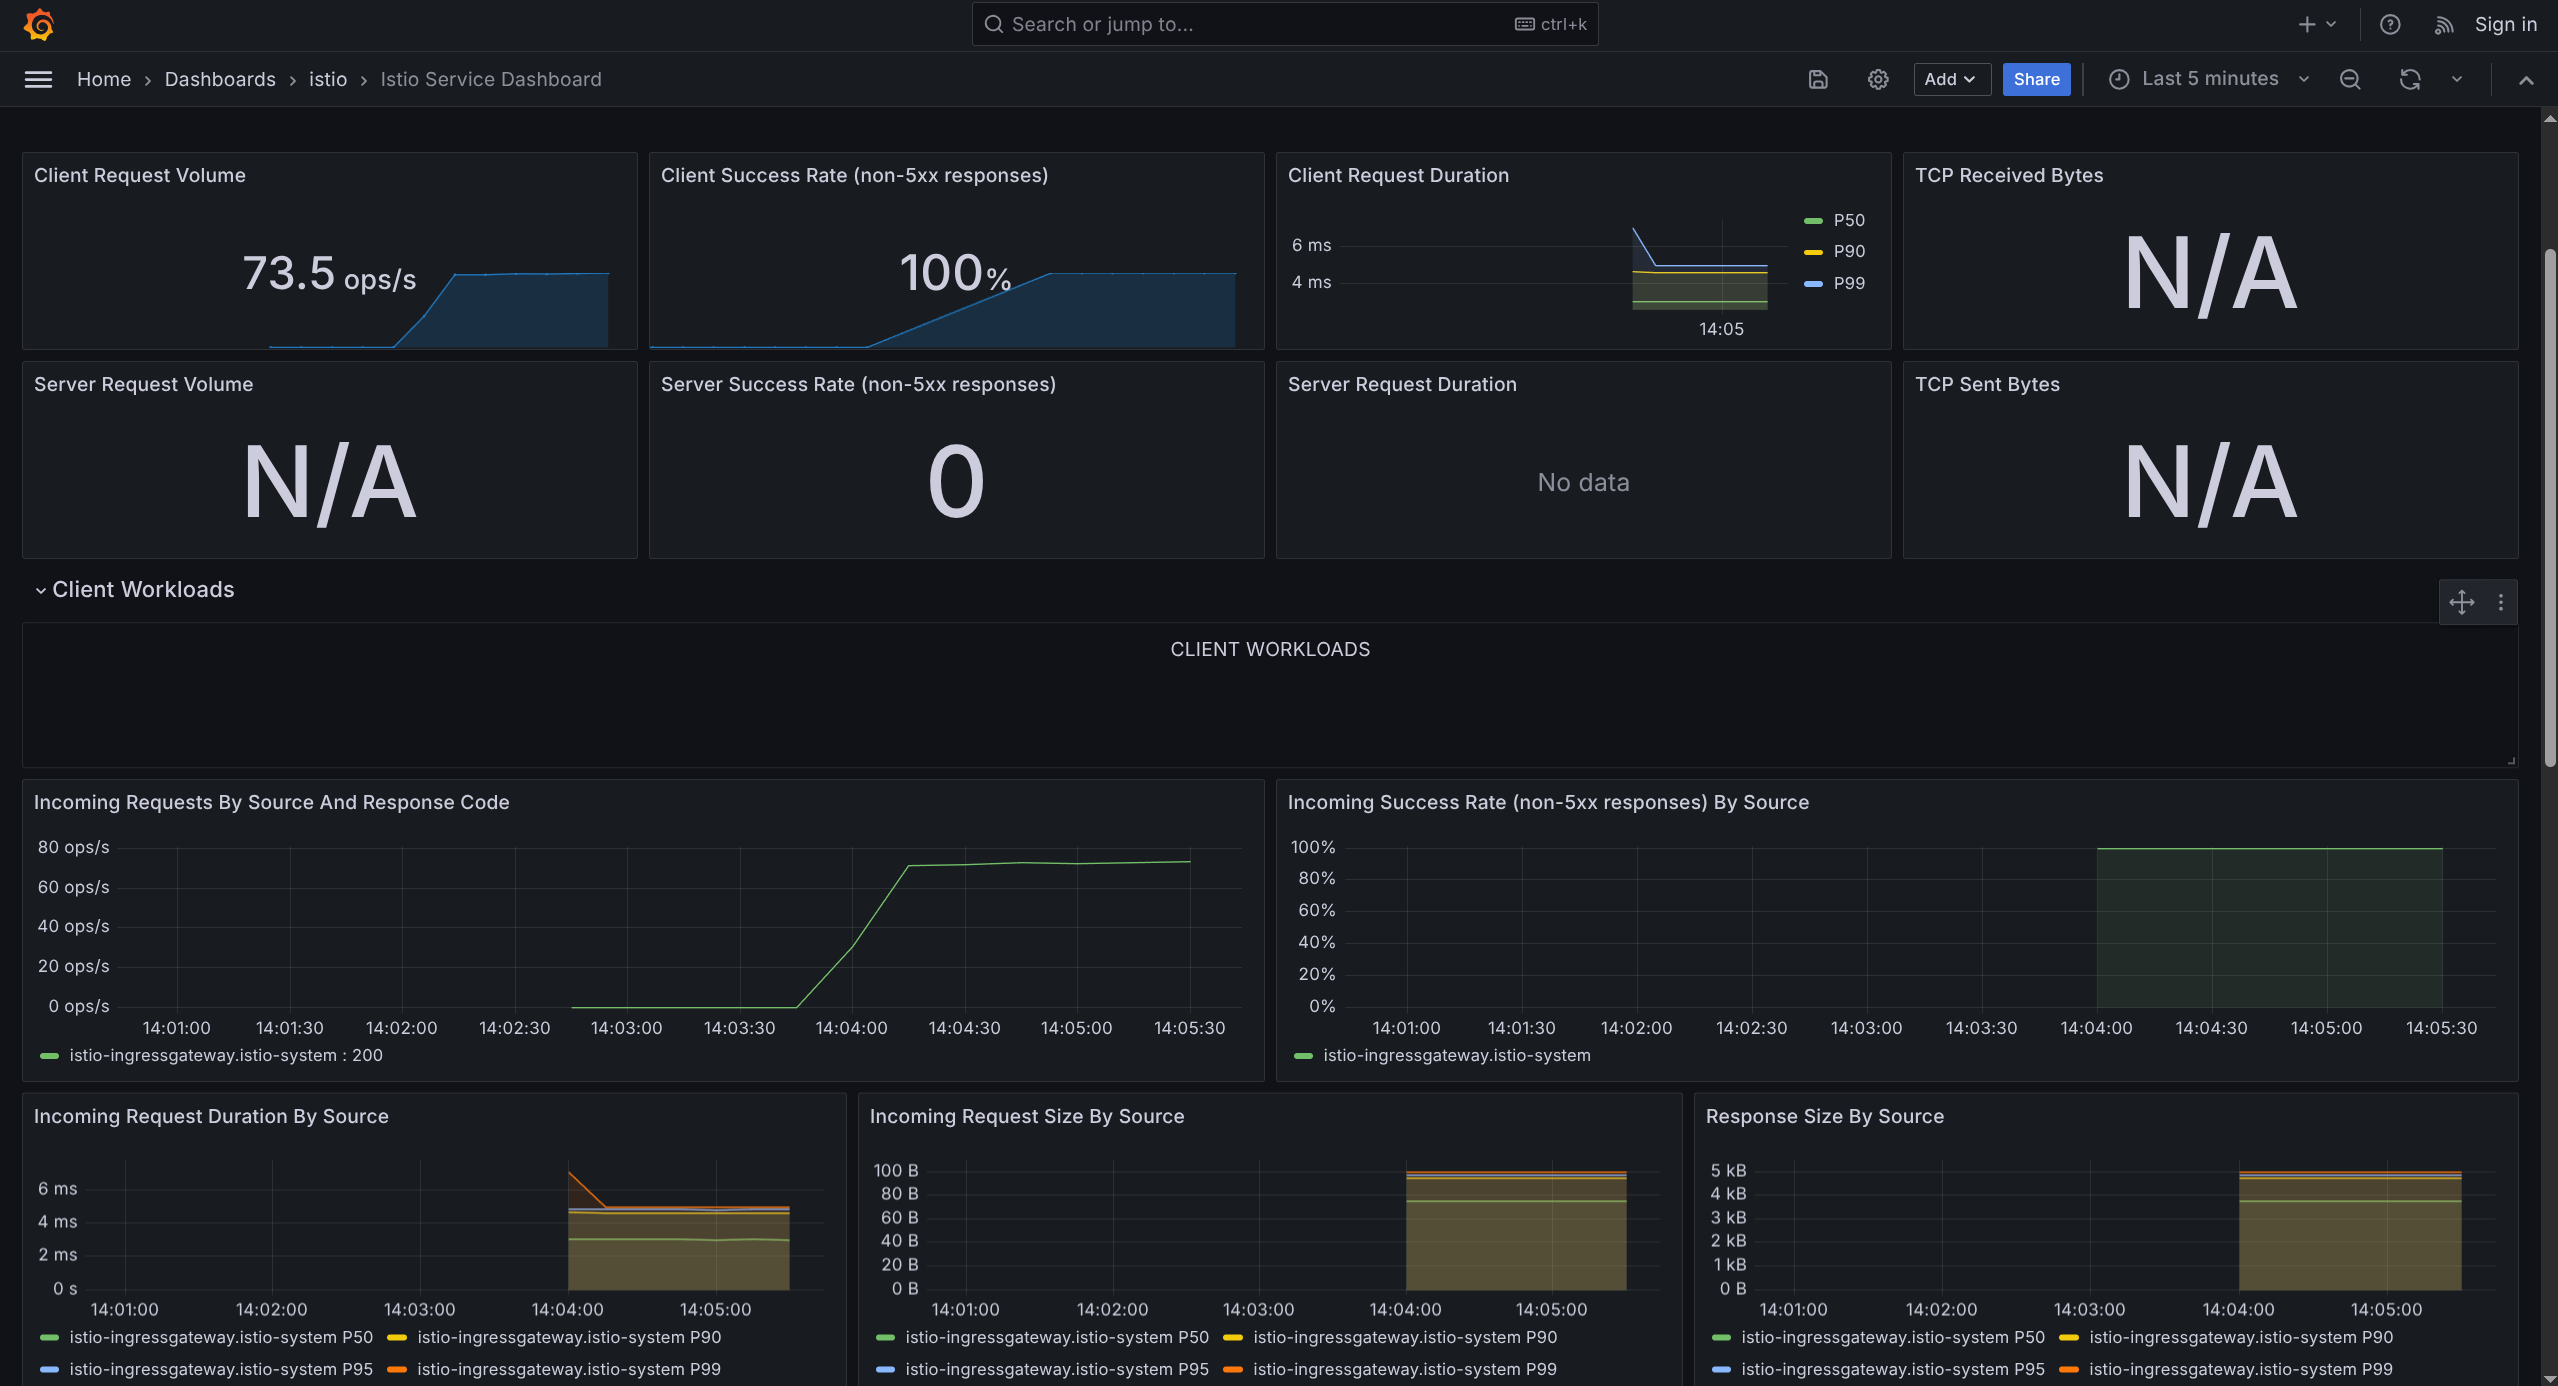
Observe Delay in Zipkin
Open Zipkin dashboard:
istioctl dashboard zipkin
Navigation steps:
- Select serviceName:
web-frontend.default - Add minDuration:
5s - Click Run Query
- Click SHOW on any trace
- Click third span (web-frontend → customers)
What to observe:
- Total duration: Approximately 5 seconds
- Tag
response_flags: DI(DI = Delay Injection indicator)
Test 2: Inject Fault (Simulate Service Failure)
Objective
Return HTTP 500 error for 50% of requests to the customers service to simulate backend failures.
Update VirtualService
apiVersion: networking.istio.io/v1
kind: VirtualService
metadata:
  name: customers
spec:
  hosts:
  - 'customers.default.svc.cluster.local'
  http:
  - route:
    - destination:
        host: customers.default.svc.cluster.local
        port:
          number: 80
        subset: v1
    fault:
      abort:
        httpStatus: 500  # Return error 500
        percentage:
          value: 50  # 50% of requests
Apply configuration:
kubectl apply -f customers-fault.yaml
Expected behavior: Approximately 50% of requests fail with HTTP 500 error.
Observe Errors in Grafana
Open Grafana dashboard:
istioctl dashboard grafana
Navigation steps:
- Navigate to Istio Service Dashboard
- Select service:
customers.default.svc.cluster.local - Select reporter:
source
What to observe:
- Client Success Rate drops to approximately 50%
- Incoming Requests by Response Code shows significant 500 errors
Observe Errors in Zipkin
Open Zipkin dashboard:
istioctl dashboard zipkin
Navigation steps:
- Select serviceName:
web-frontend.default - Click Run Query (remove minDuration filter if present)
What to observe: Failed traces displayed in red color indicating errors.
Observe Errors in Kiali
Open Kiali dashboard:
istioctl dashboard kiali
Navigation steps:
- Click Graph tab
- Examine service graph
What to observe:
- web-frontend service displays red border (indicates errors)
- Click service node for detailed metrics
- Right sidebar shows approximately 50% success rate, 50% failure rate
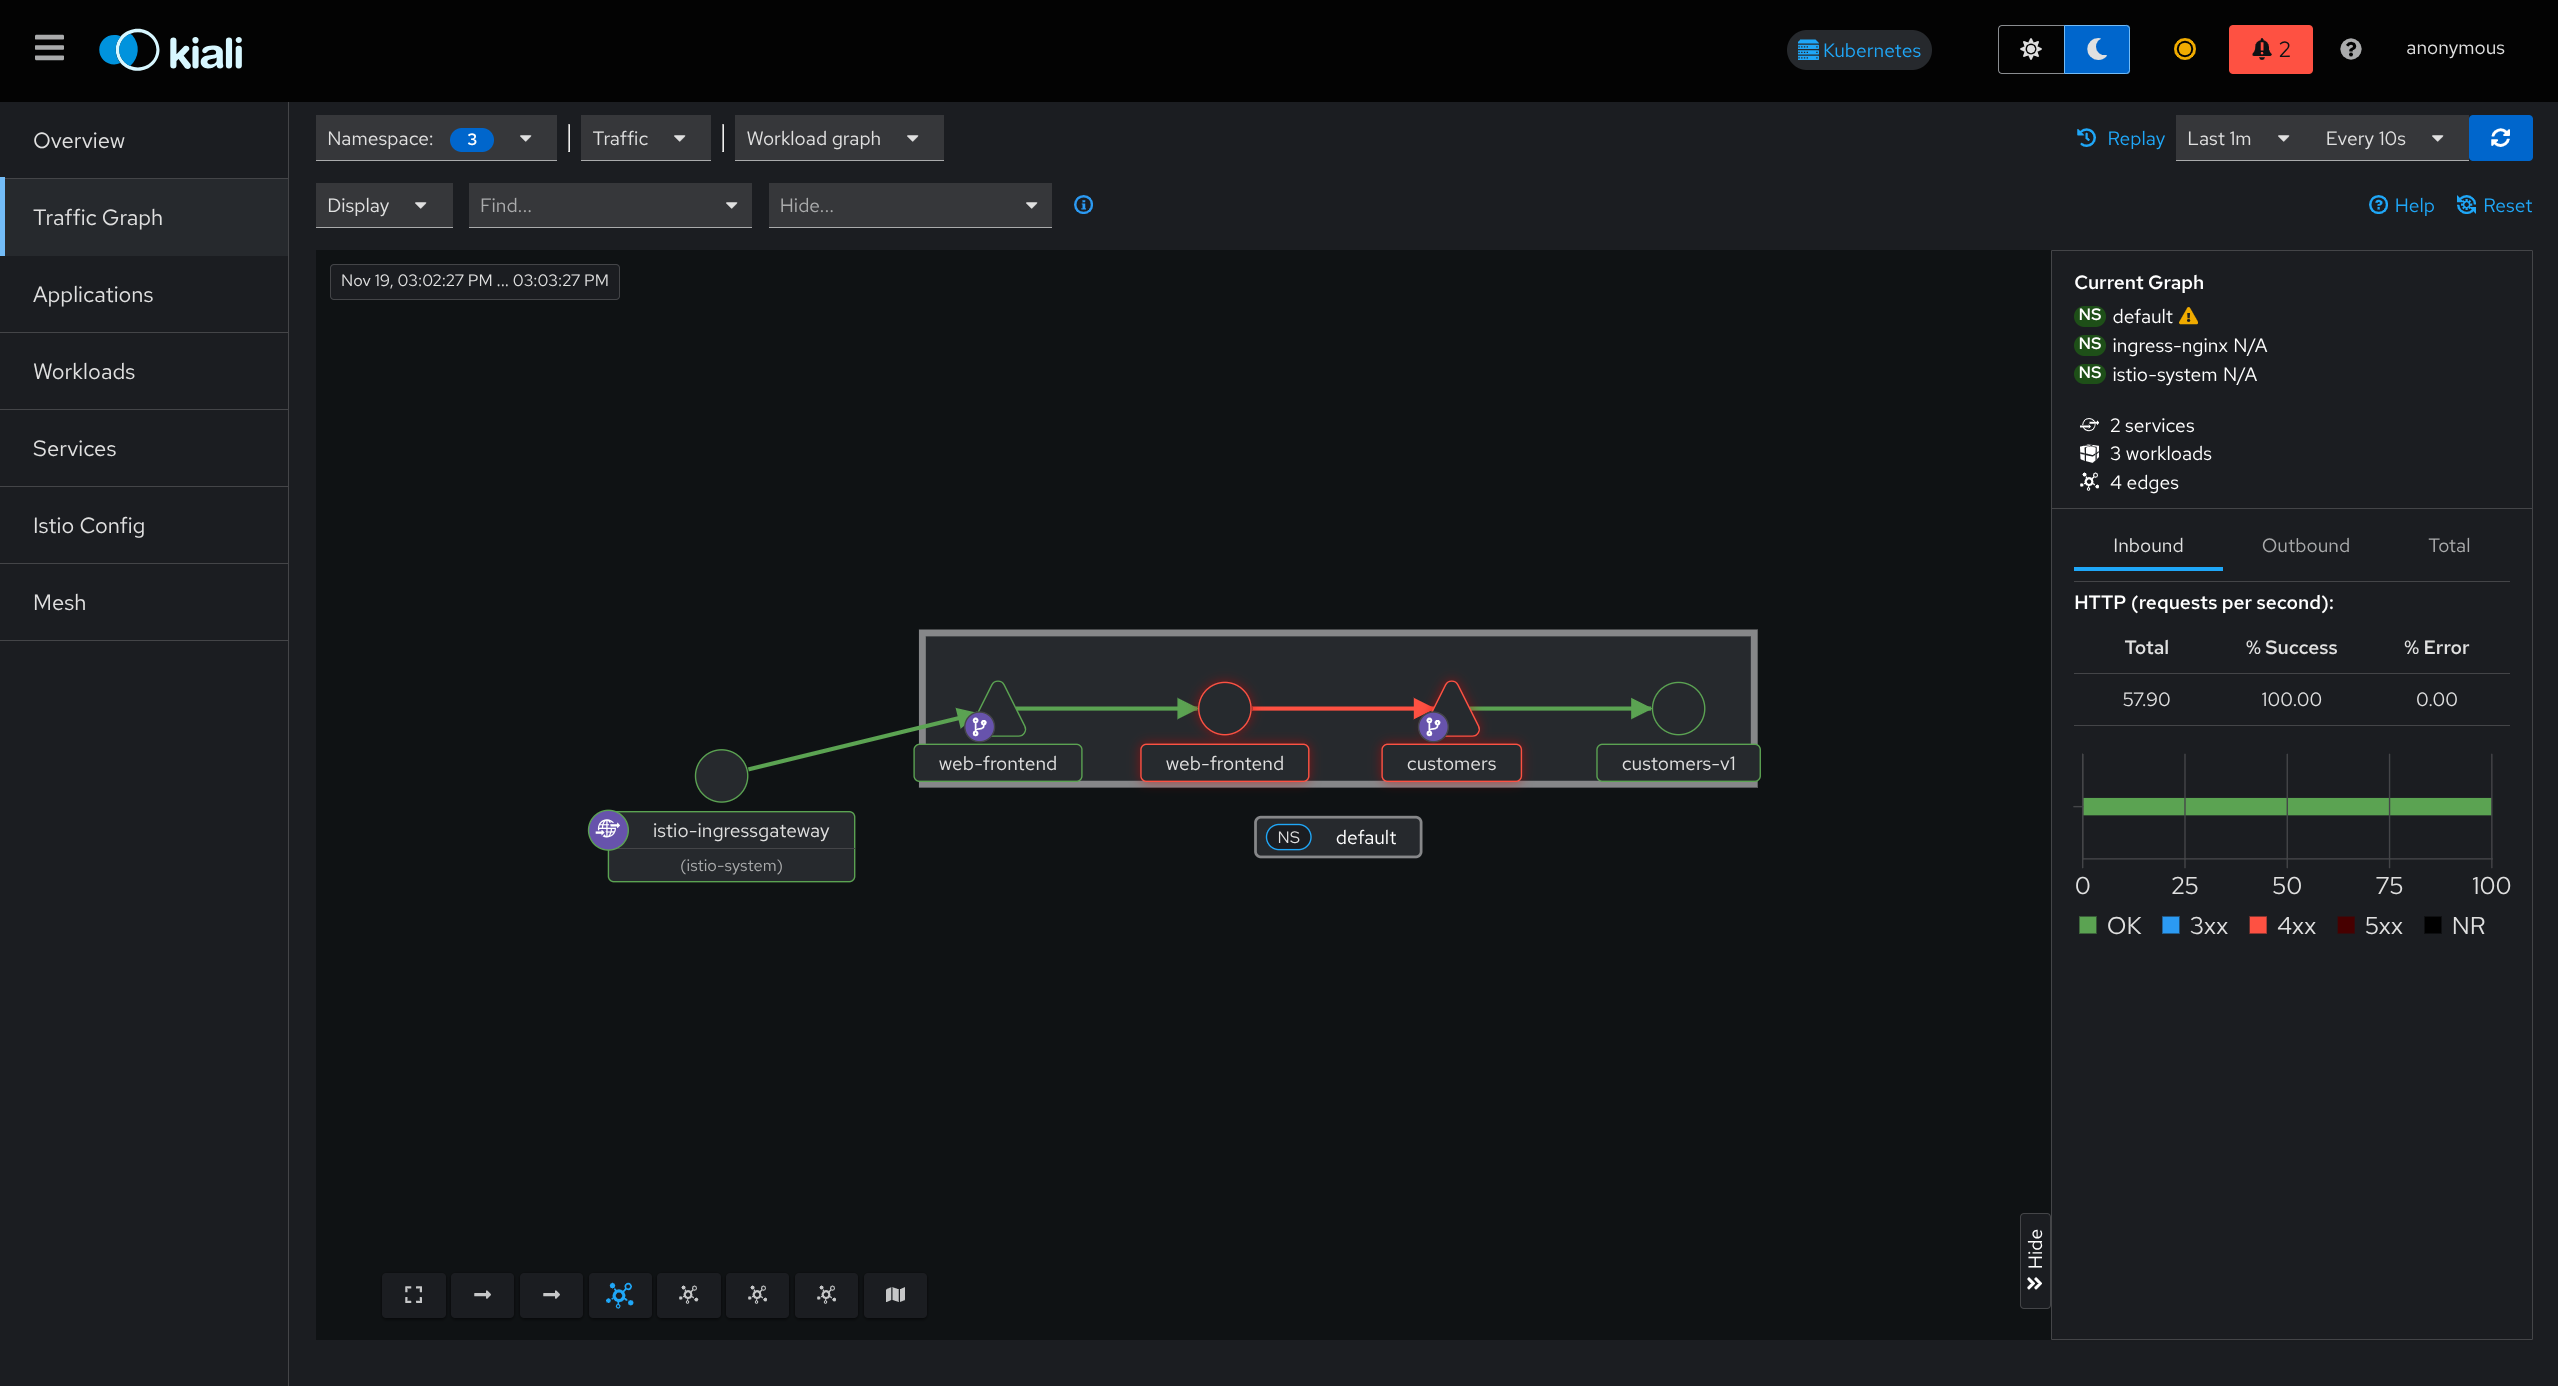
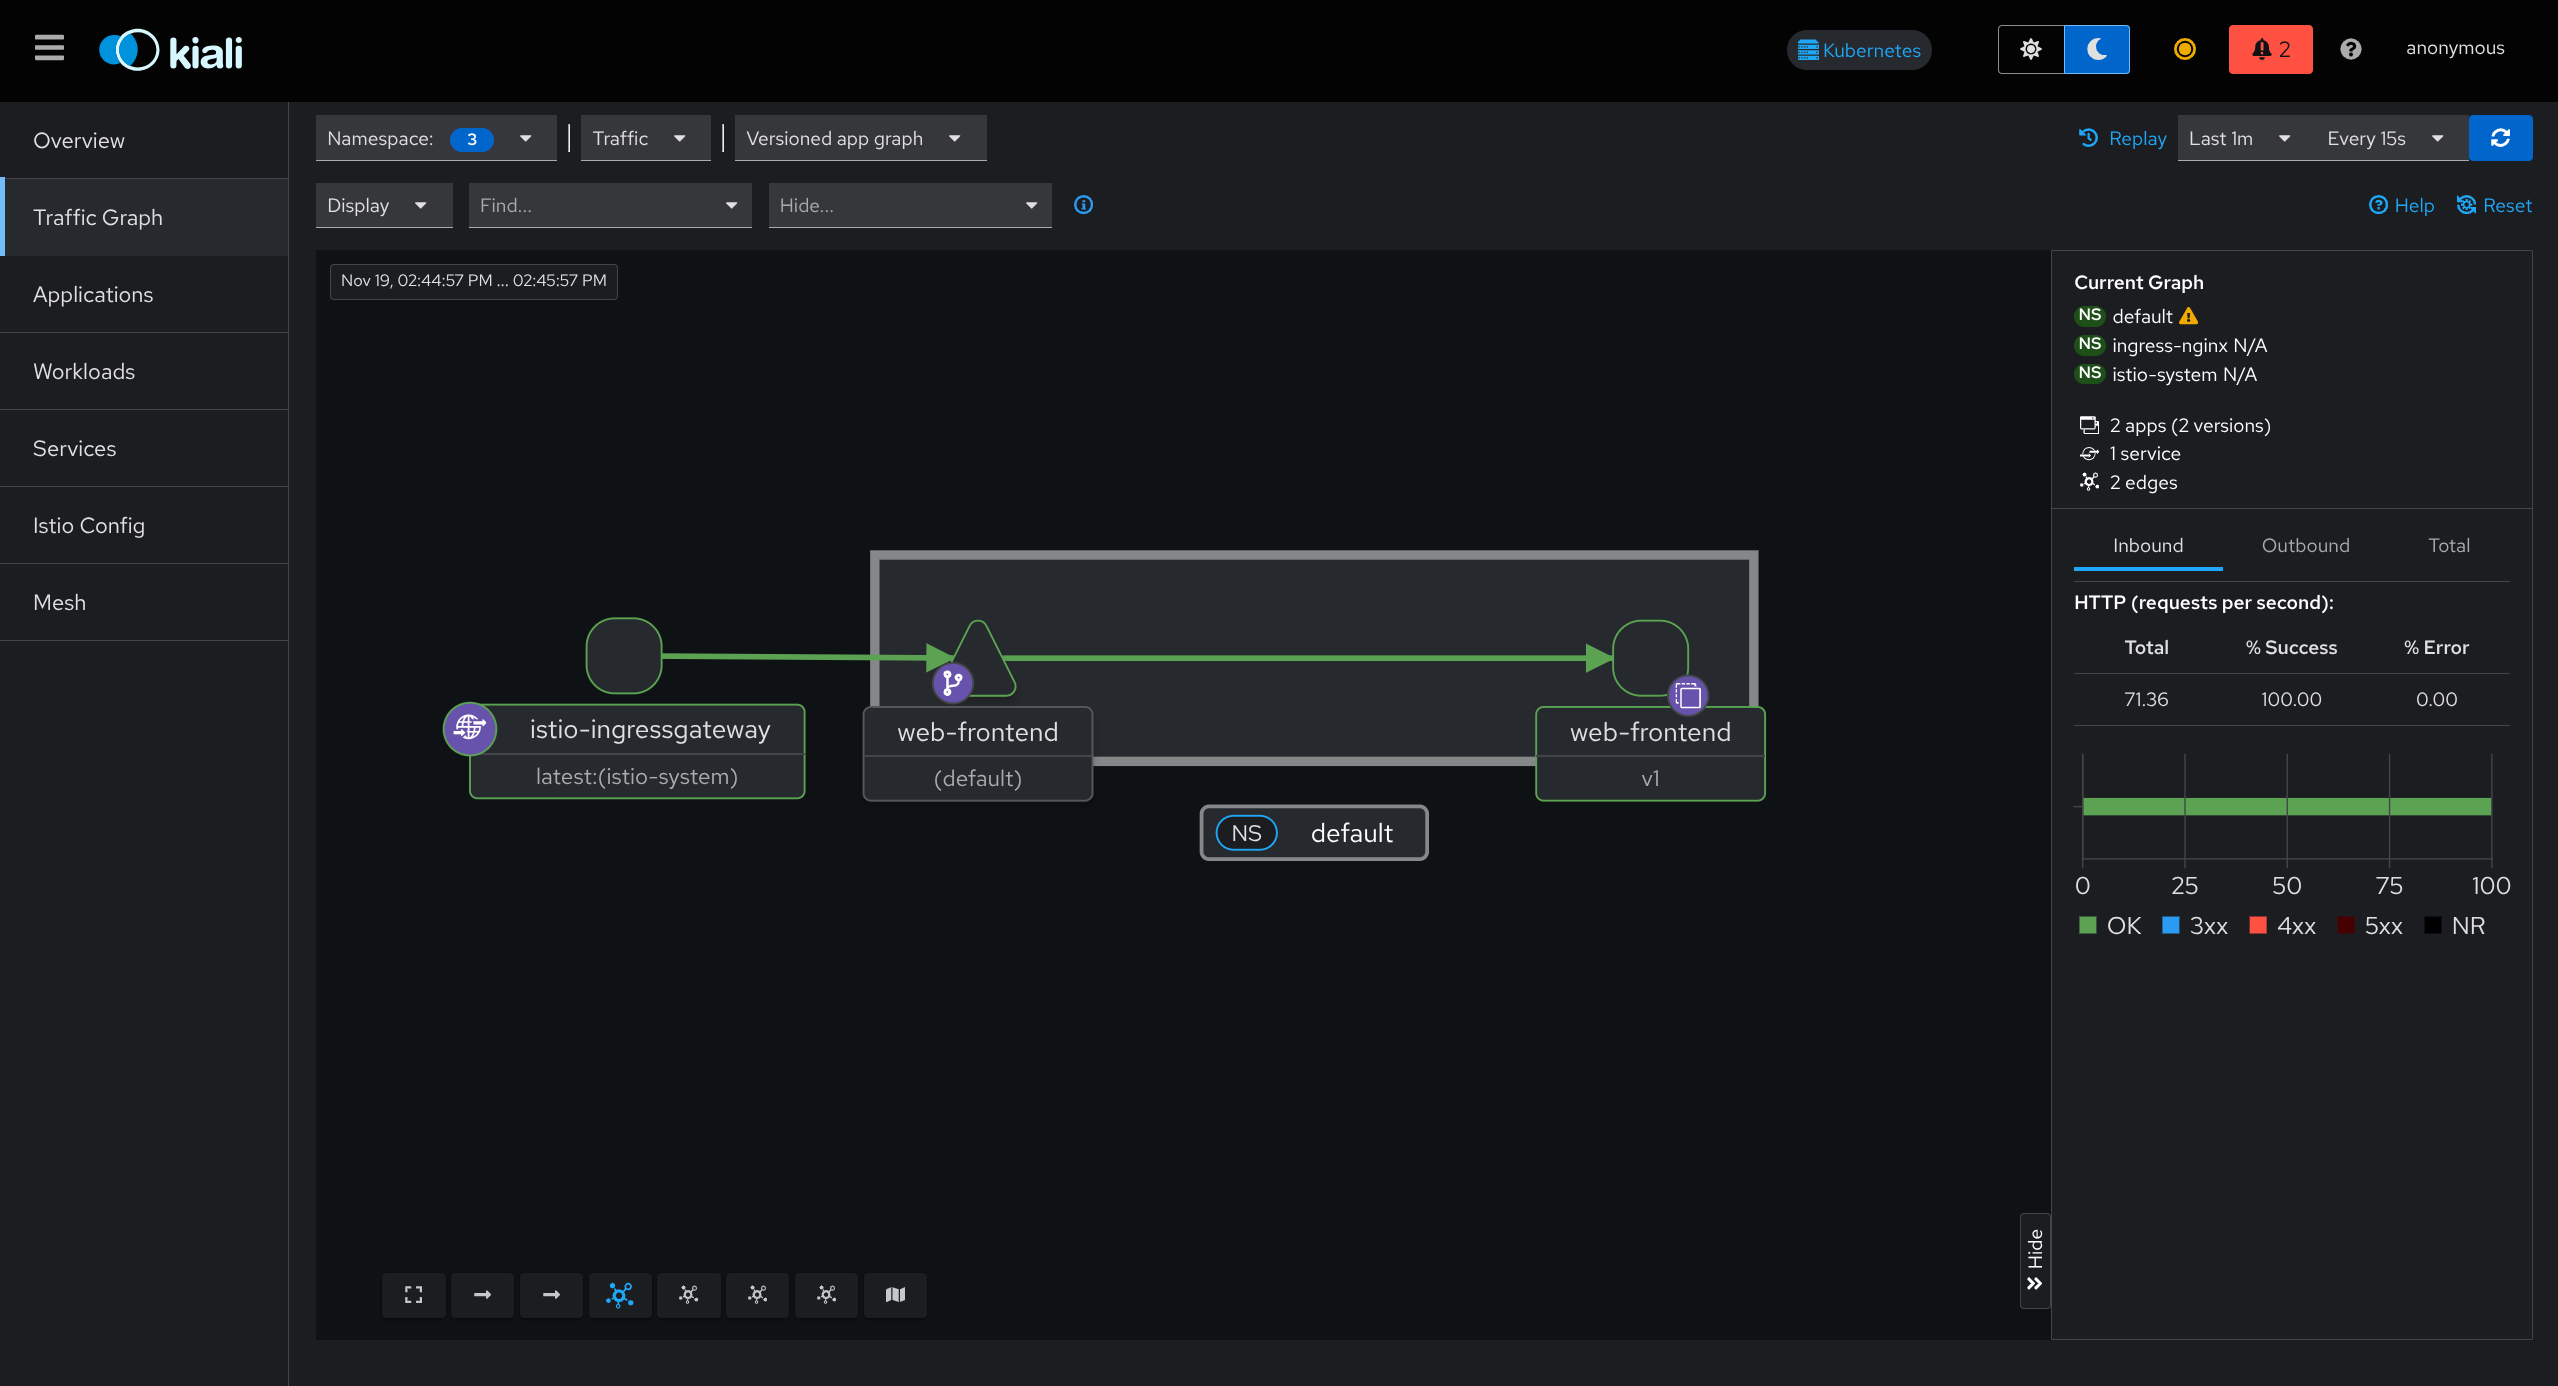
Cleanup
Remove all resources:
kubectl delete deploy web-frontend customers-v1
kubectl delete svc customers web-frontend
kubectl delete vs customers web-frontend
kubectl delete dr customers
kubectl delete gateway gateway
Observability Tools Comparison
| Tool | What It Shows | Best For |
|---|---|---|
| Grafana | Time-series graphs of latency and errors | Trend analysis, duration spikes |
| Zipkin | Individual request traces with timing | Following single request path |
| Kiali | Visual service graph with health status | Overall mesh health, problem identification |
Understanding Failure Injection
Delay Injection
Purpose: Simulates slow service response times
Use case: Test application timeout handling and user experience with slow backends
Configuration:
fault:
  delay:
    percentage:
      value: 50  # Affects 50% of requests
    fixedDelay: 5s  # Adds 5-second delay
Zipkin indicator: response_flags: DI (Delay Injection)
Fault Injection (Abort)
Purpose: Simulates service failures
Use case: Test application error handling and graceful degradation
Configuration:
fault:
  abort:
    httpStatus: 500  # Returns HTTP 500 error
    percentage:
      value: 50  # Affects 50% of requests
Result: Approximately 50% of requests fail with 500 error
Failure Injection Reference
| Failure Type | Field | Example | Effect |
|---|---|---|---|
| Delay | fault.delay | fixedDelay: 5s | Simulates slow response |
| Abort | fault.abort | httpStatus: 500 | Returns error code |
| Percentage | percentage.value | 50 | Affects 50% of requests |
Why Failure Injection Matters
Chaos Engineering: Proactively test application resilience before production issues occur.
Key questions answered:
- How does the application handle slow services?
- How does the application handle service failures?
- Are error messages user-friendly?
- Do retry mechanisms work correctly?
- Do timeout configurations work as expected?
Benefit: Identify and fix issues in testing rather than production.
Failure injection = Intentionally introduce failures to test application resilience
Two types:
- Delay = Simulates slow service (tests timeout handling)
- Abort = Simulates service failure (tests error handling)
Percentage control = Determines affected request ratio (50% = half of all requests)
Observability tools:
- Grafana = Time-series graphs showing latency and error trends
- Zipkin = Individual request traces with timing details
- Kiali = Visual service graph showing health status
Use for: Proactive resilience testing before production deployment
Configuration location: VirtualService fault section
Zipkin indicator: DI flag = Delay Injection marker for identifying injected failures
Best practice: Always test in non-production environments first
Lab 5: Simple Traffic Routing
What This Lab Covers
Deploy a web application with two versions of the customers service (v1 and v2), then split traffic between them using weight-based routing (e.g., 50% to v1, 50% to v2).
Purpose: Learn canary deployment patterns - safely test new versions with controlled traffic before full rollout.
Prerequisites
- Istio installed with sidecar injection enabled
- kubectl configured
- Gateway deployed
Application Architecture
User → Gateway → Web Frontend → Customers Service (v1 or v2)
Services:
- web-frontend: Frontend application that calls customers service
- customers-v1: Returns customer list without city information
- customers-v2: Returns customer list with city information
Step 1: Deploy Gateway
Purpose: Creates entry point for external traffic
apiVersion: networking.istio.io/v1
kind: Gateway
metadata:
  name: gateway
spec:
  selector:
    istio: ingressgateway
  servers:
  - port:
      number: 80
      name: http
      protocol: HTTP
    hosts:
    - '*'
Apply configuration:
kubectl apply -f gateway.yaml
Step 2: Deploy Web Frontend
Purpose: Deploys frontend application that communicates with customers service
apiVersion: apps/v1
kind: Deployment
metadata:
  name: web-frontend
spec:
  replicas: 1
  selector:
    matchLabels:
      app: web-frontend
  template:
    metadata:
      labels:
        app: web-frontend
        version: v1
    spec:
      containers:
      - image: gcr.io/tetratelabs/web-frontend:1.0.0
        name: web
        ports:
        - containerPort: 8080
        env:
        - name: CUSTOMER_SERVICE_URL
          value: 'http://customers.default.svc.cluster.local'

---
apiVersion: v1
kind: Service
metadata:
  name: web-frontend
spec:
  selector:
    app: web-frontend
  ports:
  - port: 80
    targetPort: 8080
Apply configuration:
kubectl apply -f web-frontend.yaml
Note: The CUSTOMER_SERVICE_URL environment variable configures the frontend to communicate with the customers service.
Step 3: Deploy Customers v1
Purpose: Deploys initial version of customers service
apiVersion: apps/v1
kind: Deployment
metadata:
  name: customers-v1
spec:
  replicas: 1
  selector:
    matchLabels:
      app: customers
      version: v1  # Important: version label
  template:
    metadata:
      labels:
        app: customers
        version: v1  # Important: version label
    spec:
      containers:
      - image: gcr.io/tetratelabs/customers:1.0.0
        name: svc
        ports:
        - containerPort: 3000

---
apiVersion: v1
kind: Service
metadata:
  name: customers
spec:
  selector:
    app: customers  # Only app label, not version
  ports:
  - port: 80
    targetPort: 3000
Apply configuration:
kubectl apply -f customers-v1.yaml
Important notes:
- Deployment includes
version: v1label for subset identification - Service uses only
app: customersselector (no version label) - This configuration enables version-specific routing
Step 4: Create VirtualService for Web Frontend
Purpose: Routes external traffic to frontend application
apiVersion: networking.istio.io/v1
kind: VirtualService
metadata:
  name: web-frontend
spec:
  hosts:
  - '*'
  gateways:
  - gateway
  http:
  - route:
    - destination:
        host: web-frontend.default.svc.cluster.local
        port:
          number: 80
Apply configuration:
kubectl apply -f web-frontend-vs.yaml
Step 5: Test v1 Only
Purpose: Verify v1 deployment before introducing v2
Get gateway URL:
kubectl get vs

export GATEWAY_URL=$(kubectl get svc -n istio-system istio-ingressgateway -o jsonpath='{.status.loadBalancer.ingress[0].ip}')
For Minikube:
minikube tunnel  # Run in separate terminal
export GATEWAY_URL=localhost
Access application:
open http://$GATEWAY_URL  # macOS
# or
xdg-open http://$GATEWAY_URL  # Linux
Expected output: Customer list without city information (v1 response).
Step 6: Create DestinationRule (Define Subsets)
Purpose: Define v1 and v2 subsets so we can route to specific versions.
apiVersion: networking.istio.io/v1
kind: DestinationRule
metadata:
  name: customers
spec:
  host: customers.default.svc.cluster.local
  subsets:
  - name: v1
    labels:
      version: v1  # Pods with version=v1
  - name: v2
    labels:
      version: v2  # Pods with version=v2
Apply configuration:
kubectl apply -f customers-dr.yaml
What this does: Creates named subsets (v1 and v2) based on pod version labels for targeted routing.
Step 7: Create VirtualService for Customers (Route to v1)
Purpose: Explicitly routes all traffic to v1 subset
apiVersion: networking.istio.io/v1
kind: VirtualService
metadata:
  name: customers
spec:
  hosts:
  - 'customers.default.svc.cluster.local'
  http:
  - route:
    - destination:
        host: customers.default.svc.cluster.local
        port:
          number: 80
        subset: v1  # Send all traffic to v1
Apply configuration:
kubectl apply -f customers-vs.yaml
What this does: Routes 100% of traffic to v1 subset.
Step 8: Deploy Customers v2
Purpose: Deploys new version without affecting existing traffic
apiVersion: apps/v1
kind: Deployment
metadata:
  name: customers-v2
spec:
  replicas: 1
  selector:
    matchLabels:
      app: customers
      version: v2  # Important: version label
  template:
    metadata:
      labels:
        app: customers
        version: v2  # Important: version label
    spec:
      containers:
      - image: gcr.io/tetratelabs/customers:2.0.0  # v2 image
        name: svc
        ports:
        - containerPort: 3000
Apply configuration:
kubectl apply -f customers-v2.yaml
Expected behavior: v2 deployment completes but receives no traffic (VirtualService still routes 100% to v1).
Step 9: Split Traffic 50/50
Purpose: Send half traffic to v1, half to v2 (canary deployment).
apiVersion: networking.istio.io/v1
kind: VirtualService
metadata:
  name: customers
spec:
  hosts:
  - 'customers.default.svc.cluster.local'
  http:
  - route:
    - destination:
        host: customers.default.svc.cluster.local
        port:
          number: 80
        subset: v1
      weight: 50  # 50% to v1
    - destination:
        host: customers.default.svc.cluster.local
        port:
          number: 80
        subset: v2
      weight: 50  # 50% to v2
Apply configuration:
kubectl apply -f customers-50-50.yaml
Test Traffic Split
Access application:
open http://$GATEWAY_URL  # macOS
# or
xdg-open http://$GATEWAY_URL  # Linux
Testing procedure:
- Refresh page multiple times
- Observe alternating responses:
- Customer list WITHOUT city information (v1 response)
- Customer list WITH city information (v2 response)
- Verify approximately 50/50 distribution
Alternative testing with curl:
for i in {1..10}; do
  curl -s http://$GATEWAY_URL/ | grep -o "city" && echo "v2" || echo "v1"
  sleep 1
done
Cleanup
Remove all resources:
kubectl delete deploy web-frontend customers-v1 customers-v2
kubectl delete svc customers web-frontend
kubectl delete vs customers web-frontend
kubectl delete dr customers
kubectl delete gateway gateway
Understanding Key Concepts
Subsets
Definition: Named groups of pods identified by labels
Configured in: DestinationRule
Example:
subsets:
- name: v1
  labels:
    version: v1
- name: v2
  labels:
    version: v2
Purpose: Enables version-specific traffic routing
Weight-Based Routing
Definition: Distributes traffic across versions using percentage weights
Configured in: VirtualService
Example:
- destination:
    subset: v1
  weight: 90  # 90% to v1
- destination:
    subset: v2
  weight: 10  # 10% to v2
Common use cases:
- Canary deployment: 10% new version, 90% old version
- A/B testing: 50/50 split for comparison
- Blue-green deployment: 100% to one version, then switch
Traffic Split Scenarios
| Scenario | v1 Weight | v2 Weight | Use Case |
|---|---|---|---|
| Initial state | 100 | 0 | Before deploying new version |
| Canary start | 90 | 10 | Test new version with minimal traffic |
| A/B testing | 50 | 50 | Compare versions with equal distribution |
| Near completion | 10 | 90 | New version validated, final migration |
| Complete migration | 0 | 100 | Fully migrated to new version |
Canary Deployment Flow
Step-by-step progression:
1. Deploy v1 (100% traffic)
   ↓
2. Create DestinationRule (define v1 and v2 subsets)
   ↓
3. Create VirtualService (route 100% to v1)
   ↓
4. Deploy v2 (receives 0% traffic)
   ↓
5. Update VirtualService (split 90% v1, 10% v2)
   ↓
6. Monitor v2 (check errors, latency, metrics)
   ↓
7. Gradually increase v2 traffic (50/50, then 90/10)
   ↓
8. Complete migration (100% to v2)
   ↓
9. Remove v1 deployment
Benefits of Traffic Splitting
Canary Deployment Advantages:
- Risk mitigation: Test new version with small percentage of users
- Easy rollback: Simply adjust weights without redeployment
- Zero downtime: Seamless transition between versions
- Gradual migration: Controlled, incremental rollout
Comparison:
- Without Istio: Requires complex load balancer configuration or multiple services
- With Istio: Simple YAML weight adjustments
Configuration Reference
| Resource | Purpose | Key Fields |
|---|---|---|
| DestinationRule | Define subsets | subsets[].name, subsets[].labels |
| VirtualService | Route traffic | route[].destination.subset, route[].weight |
| Deployment | Run pods | labels.version (for subsets) |
| Service | Expose pods | selector.app (no version) |
Best Practices
Version Labeling:
- Always include
versionlabel in Deployment - Service selector should use only
applabel (not version) - Consistent labeling enables proper subset routing
Weight Distribution:
- Weights must sum to 100
- Start with small percentages for new versions (10%)
- Gradually increase based on metrics and monitoring
- Common patterns: 90/10, 70/30, 50/50
Monitoring:
- Watch error rates during traffic shifts
- Monitor latency for both versions
- Use Grafana, Kiali, or Prometheus for real-time metrics
- Set up alerts for anomalies
Rollback Strategy:
- Keep previous version running during migration
- Document weight configurations for quick rollback
- Test rollback procedure before production deployment
Traffic splitting = Distribute traffic across versions using percentage weights
DestinationRule = Defines subsets (v1, v2) based on pod labels
VirtualService = Routes traffic with weights (e.g., 50% v1, 50% v2)
Canary deployment = Gradual rollout pattern (10% → 50% → 100%)
Version label = Required on Deployment, excluded from Service selector
Weight constraint = Must sum to 100 (e.g., 50+50, 90+10, 70+30)
Use cases: Safe deployments, A/B testing, gradual migrations, feature rollouts
Easy rollback = Adjust weights without redeployment
Configuration-only = No application code changes required (YAML only)
Zero downtime = Seamless version transitions without service interruption
Lab 6: Advanced Traffic Routing (Header-Based)
What This Lab Covers
Deploy a web application with two versions of the customers service, then route traffic based on request headers instead of percentage weights. Requests with header user: debug go to v2, all others go to v1.
Purpose: Learn header-based routing for targeted feature testing with specific users without affecting the entire user base.
Prerequisites
- Istio installed with sidecar injection enabled
- kubectl configured
- Gateway deployed
Application Architecture
User → Gateway → Web Frontend → Customers Service (v1 or v2 based on header)
Services:
- web-frontend: Frontend application that calls customers service
- customers-v1: Returns customer list without city information (default)
- customers-v2: Returns customer list with city information (for debug users)
Step 1: Deploy All Components
Purpose: Deploy complete application stack with both service versions and initial routing configuration
Gateway:
apiVersion: networking.istio.io/v1
kind: Gateway
metadata:
  name: gateway
spec:
  selector:
    istio: ingressgateway
  servers:
  - port:
      number: 80
      name: http
      protocol: HTTP
    hosts:
    - '*'
Web Frontend:
apiVersion: apps/v1
kind: Deployment
metadata:
  name: web-frontend
spec:
  replicas: 1
  selector:
    matchLabels:
      app: web-frontend
  template:
    metadata:
      labels:
        app: web-frontend
        version: v1
    spec:
      containers:
      - image: gcr.io/tetratelabs/web-frontend:1.0.0
        name: web
        ports:
        - containerPort: 8080
        env:
        - name: CUSTOMER_SERVICE_URL
          value: 'http://customers.default.svc.cluster.local'
---
apiVersion: v1
kind: Service
metadata:
  name: web-frontend
spec:
  selector:
    app: web-frontend
  ports:
  - port: 80
    targetPort: 8080
---
apiVersion: networking.istio.io/v1
kind: VirtualService
metadata:
  name: web-frontend
spec:
  hosts:
  - '*'
  gateways:
  - gateway
  http:
  - route:
    - destination:
        host: web-frontend.default.svc.cluster.local
        port:
          number: 80
Customers (v1, v2, Service, DestinationRule, VirtualService):
apiVersion: apps/v1
kind: Deployment
metadata:
  name: customers-v1
spec:
  replicas: 1
  selector:
    matchLabels:
      app: customers
      version: v1
  template:
    metadata:
      labels:
        app: customers
        version: v1
    spec:
      containers:
      - image: gcr.io/tetratelabs/customers:1.0.0
        name: svc
        ports:
        - containerPort: 3000
---
apiVersion: apps/v1
kind: Deployment
metadata:
  name: customers-v2
spec:
  replicas: 1
  selector:
    matchLabels:
      app: customers
      version: v2
  template:
    metadata:
      labels:
        app: customers
        version: v2
    spec:
      containers:
      - image: gcr.io/tetratelabs/customers:2.0.0
        name: svc
        ports:
        - containerPort: 3000
---
apiVersion: v1
kind: Service
metadata:
  name: customers
spec:
  selector:
    app: customers
  ports:
  - port: 80
    targetPort: 3000
---
apiVersion: networking.istio.io/v1
kind: VirtualService
metadata:
  name: customers
spec:
  hosts:
  - 'customers.default.svc.cluster.local'
  http:
  - route:
    - destination:
        host: customers.default.svc.cluster.local
        port:
          number: 80
        subset: v1
---
apiVersion: networking.istio.io/v1
kind: DestinationRule
metadata:
  name: customers
spec:
  host: customers.default.svc.cluster.local
  subsets:
  - name: v1
    labels:
      version: v1
  - name: v2
    labels:
      version: v2
Apply configuration:
kubectl apply -f gateway.yaml
kubectl apply -f web-frontend.yaml
kubectl apply -f customers.yaml
What this does:
- Creates gateway for external access
- Deploys web-frontend application
- Deploys both customers-v1 and customers-v2
- Creates service and routing rules
- Initially routes all traffic to v1
Step 2: Test Default Routing (All Traffic to v1)
Purpose: Verify initial configuration routes all traffic to v1 before adding header-based routing
Get gateway URL:
kubectl get vs

export GATEWAY_URL=$(kubectl get svc -n istio-system istio-ingressgateway -o jsonpath='{.status.loadBalancer.ingress[0].ip}')
For Minikube:
minikube tunnel  # Run in separate terminal
export GATEWAY_URL=localhost
Test application:
curl http://$GATEWAY_URL/
Expected output: Customer list WITHOUT city information (v1 response).
Step 3: Configure Header-Based Routing
Purpose: Update VirtualService to route traffic based on request header presence
apiVersion: networking.istio.io/v1
kind: VirtualService
metadata:
  name: customers
spec:
  hosts:
  - 'customers.default.svc.cluster.local'
  http:
  - match:
    - headers:
        user:
          exact: debug  # If header "user: debug"
    route:
    - destination:
        host: customers.default.svc.cluster.local
        port:
          number: 80
        subset: v2  # Go to v2
  - route:
    - destination:
        host: customers.default.svc.cluster.local
        port:
          number: 80
        subset: v1  # Default: go to v1
Apply configuration:
kubectl apply -f customers-vs.yaml
What this does:
- First match block checks for
user: debugheader → routes to v2 - Second route block (no match) acts as default → routes to v1
- Order matters: specific matches first, default last
Step 4: Test Header-Based Routing
Purpose: Verify routing behavior with and without custom header
Test Without Header (Default to v1)
curl http://$GATEWAY_URL/
Expected output: Customer list WITHOUT city information (v1 response).
Test With Header (Route to v2)
curl -H "user: debug" http://$GATEWAY_URL/
Expected output: Customer list WITH city information (v2 response).
Testing in Browser
Purpose: Test header-based routing using browser extension
Using ModHeader Extension (Chrome/Firefox)
Installation steps:
- Install ModHeader extension from browser store
- Click extension icon
- Add request header:
user=debug - Navigate to
http://$GATEWAY_URL/ - Observe v2 response (with city information)
- Remove header from ModHeader
- Refresh page
- Observe v1 response (without city information)
What this demonstrates: Same URL, different responses based on header presence.
Understanding Header-Based Routing
Match Block Evaluation
Header matching syntax:
- match:
  - headers:
      user:
        exact: debug
Evaluation order (first match wins):
- Check if
user: debugheader exists → route to v2 - No matching header → fall through to default route → route to v1
Important: Always place specific match conditions before default routes.
Header Match Types
| Type | Example | Matches | Use Case |
|---|---|---|---|
| exact | exact: debug | Exactly "debug" | Specific value matching |
| prefix | prefix: test | "test", "testing", "test123" | Partial value matching |
| regex | regex: "^test.*" | Starts with "test" | Pattern matching |
Additional Routing Match Options
URI Path Matching
- match:
  - uri:
      prefix: /api/v2
  route:
  - destination:
      subset: v2
Query Parameter Matching
- match:
  - queryParams:
      version:
        exact: "2"  # ?version=2
  route:
  - destination:
      subset: v2
HTTP Method Matching
- match:
  - method:
      exact: POST
  route:
  - destination:
      subset: v2
Combining Multiple Match Conditions
AND Logic (Same Match Block)
Purpose: All conditions must be true for match to succeed
- match:
  - headers:
      user:
        exact: debug
    uri:
      prefix: /api  # BOTH must match
  route:
  - destination:
      subset: v2
OR Logic (Separate Match Blocks)
Purpose: Any condition can trigger the match
- match:
  - headers:
      user:
        exact: debug
  - uri:
      prefix: /api/v2  # EITHER can match
  route:
  - destination:
      subset: v2
Real-World Use Cases
| Use Case | Match Condition | Benefit | Example |
|---|---|---|---|
| Debug users | user: debug | Test with specific users | Internal testing |
| Beta testers | beta-user: true | Early access features | Feature preview |
| Mobile app | user-agent: .*Mobile.* | Different version for mobile | Mobile optimization |
| API versioning | uri: /api/v2 | Version by URL | API migration |
| Regional rollout | region: us-west | Geographic targeting | Staged deployment |
Cleanup
Remove all resources:
kubectl delete deploy web-frontend customers-v1 customers-v2
kubectl delete svc customers web-frontend
kubectl delete vs customers web-frontend
kubectl delete dr customers
kubectl delete gateway gateway
Match Configuration Reference
| Match Type | Field | Example Value | Description |
|---|---|---|---|
| Header | headers.name.exact | debug | Request header matching |
| URI | uri.prefix | /api/v2 | URL path matching |
| Query | queryParams.name.exact | 2 | Query parameter matching |
| Method | method.exact | POST | HTTP method matching |
Best Practices
Match Order:
- Place most specific matches first
- Always include default route last (no match block)
- Test match precedence carefully
Header Selection:
- Use custom headers for internal testing (
x-debug,x-beta-user) - Leverage standard headers for device targeting (
user-agent) - Document header requirements for team
Testing Strategy:
- Test both match and non-match scenarios
- Verify default route behavior
- Use browser extensions for manual testing
- Automate tests with curl scripts
Production Considerations:
- Remove debug headers before production
- Use authentication for beta features
- Monitor traffic distribution
- Document routing logic clearly
Header-based routing = Route traffic based on request properties instead of percentage weights
Match block = Defines conditions (if header exists, route to specific version)
Order matters = First match wins - place specific rules first, default route last
Match types = exact (precise), prefix (starts with), regex (pattern)
Multiple conditions = AND logic (same block) or OR logic (separate blocks)
Use cases = Debug users, beta testing, device targeting, API versioning, regional rollout
Configuration-only = No application code changes required (YAML only)
Combine with weights = Can use both header matching AND weight-based routing together
Always include default = Last route with no match block catches all other traffic
Testing tools = curl for CLI testing, ModHeader extension for browser testing
Advantages over weight-based:
- Precise user targeting (not random percentage)
- Deterministic routing (same user always gets same version)
- Easy to control who sees new features
- No impact on general user population
Istio Security
Authentication
What is Authentication?
Authentication = Proving who you are. Like showing your passport at airport.
In Istio: Services prove their identity to each other before talking.
Question it answers: "Is this really Service X trying to talk to me?"
Access Control Question
Basic question: Can a subject perform an action on an object?
In Kubernetes/Istio: Can Service X perform an action on Service Y?
Three key parts:
- Principal = Who (Service X)
- Action = What (GET, POST, PUT request)
- Object = Where (Service Y)
Example: Can frontend service (principal) make GET request (action) to backend service (object)?
How Istio Does Authentication
Service Identity in Kubernetes
Service Account = Identity given to each pod
- Every pod gets unique identity
- Used when pods talk to each other
- Like a passport for services
SPIFFE Identity
What is SPIFFE? = Secure Production Identity Framework for Everyone
What Istio does:
- Takes X.509 certificate from service account
- Creates SPIFFE identity from it
- Puts identity in certificate
SPIFFE format:
spiffe://cluster.local/ns/<namespace>/sa/<service-account>
Example:
spiffe://cluster.local/ns/default/sa/frontend
This means: Service in default namespace using frontend service account
Where Identity is Stored
Subject Alternate Name (SAN) = Field in certificate that stores SPIFFE identity
Like: Name field in your passport
How Authentication Works
Sidecar Mode
Who does it: Envoy proxy (sidecar next to your app)
When: During TLS handshake (when two services connect)
What happens:
- Service A wants to talk to Service B
- Envoy proxies do TLS handshake
- Envoy checks SAN field in certificate
- Verifies SPIFFE identity
- If valid → Connection allowed
- If invalid → Connection rejected
Ambient Mode
Who does it: ztunnel (node-level proxy)
Difference: Validation happens at node level, not per pod
Same result: Identity verified before connection allowed
After Authentication
Once authenticated:
- We know WHO the service is
- Identity is validated and trusted
- Can now use identity for security policies
- Can enforce authorization rules (what they can do)
Flow:
1. Service presents certificate
   ↓
2. Proxy validates SPIFFE identity
   ↓
3. Identity confirmed (authenticated)
   ↓
4. Can now check authorization (what they're allowed to do)
Key Concepts Summary
| Concept | What It Is | Example |
|---|---|---|
| Authentication | Proving identity | Showing passport |
| Service Account | Pod's identity | frontend-sa |
| SPIFFE | Identity format | spiffe://cluster.local/ns/default/sa/frontend |
| X.509 Certificate | Digital identity document | Like digital passport |
| SAN Field | Where identity is stored | Name field in passport |
| TLS Handshake | When validation happens | Security check at border |
Authentication vs Authorization
| Authentication | Authorization | |
|---|---|---|
| Question | Who are you? | What can you do? |
| Example | Showing ID | Checking permissions |
| In Istio | Verify SPIFFE identity | Check access policies |
| Happens | First | Second (after authentication) |
| Result | Authenticated principal | Allowed or denied action |
Authentication = Proving who you are (identity verification)
Service Account = Identity for pods in Kubernetes
SPIFFE = Standard format for service identity (spiffe://cluster.local/ns/...)
X.509 Certificate = Digital document containing identity
SAN field = Where SPIFFE identity is stored in certificate
Validation happens:
- Sidecar mode: Envoy proxy validates during TLS handshake
- Ambient mode: ztunnel validates at node level
After authentication: Identity is trusted, can enforce authorization policies
Use for: Secure service-to-service communication, zero-trust networking
Certificate Creation and Rotation
What are Certificates?
X.509 Certificate = Digital document that proves identity. Like a digital passport.
Purpose: Enable mTLS (mutual TLS) for secure communication between services.
Managed by: Istio handles everything automatically - creation, renewal, rotation.
Certificate Lifecycle
Three stages:
- Issuance = Creating new certificate
- Renewal = Updating before expiration
- Rotation = Replacing old with new certificate
All automatic = No manual work needed!
Sidecar Mode - Certificate Management
Who Does What?
Three components work together:
-
Istiod (Control Plane)
- Acts as Certificate Authority (CA)
- Issues and signs certificates
- Like a government issuing passports
-
Istio Agent (pilot-agent)
- Runs alongside Envoy proxy in each pod
- Requests certificates from istiod
- Handles rotation automatically
- Like your assistant getting passport renewed
-
Envoy Proxy
- Uses certificates for mTLS
- Handles secure communication
- Like using passport to travel
How Certificate Issuance Works (Sidecar)
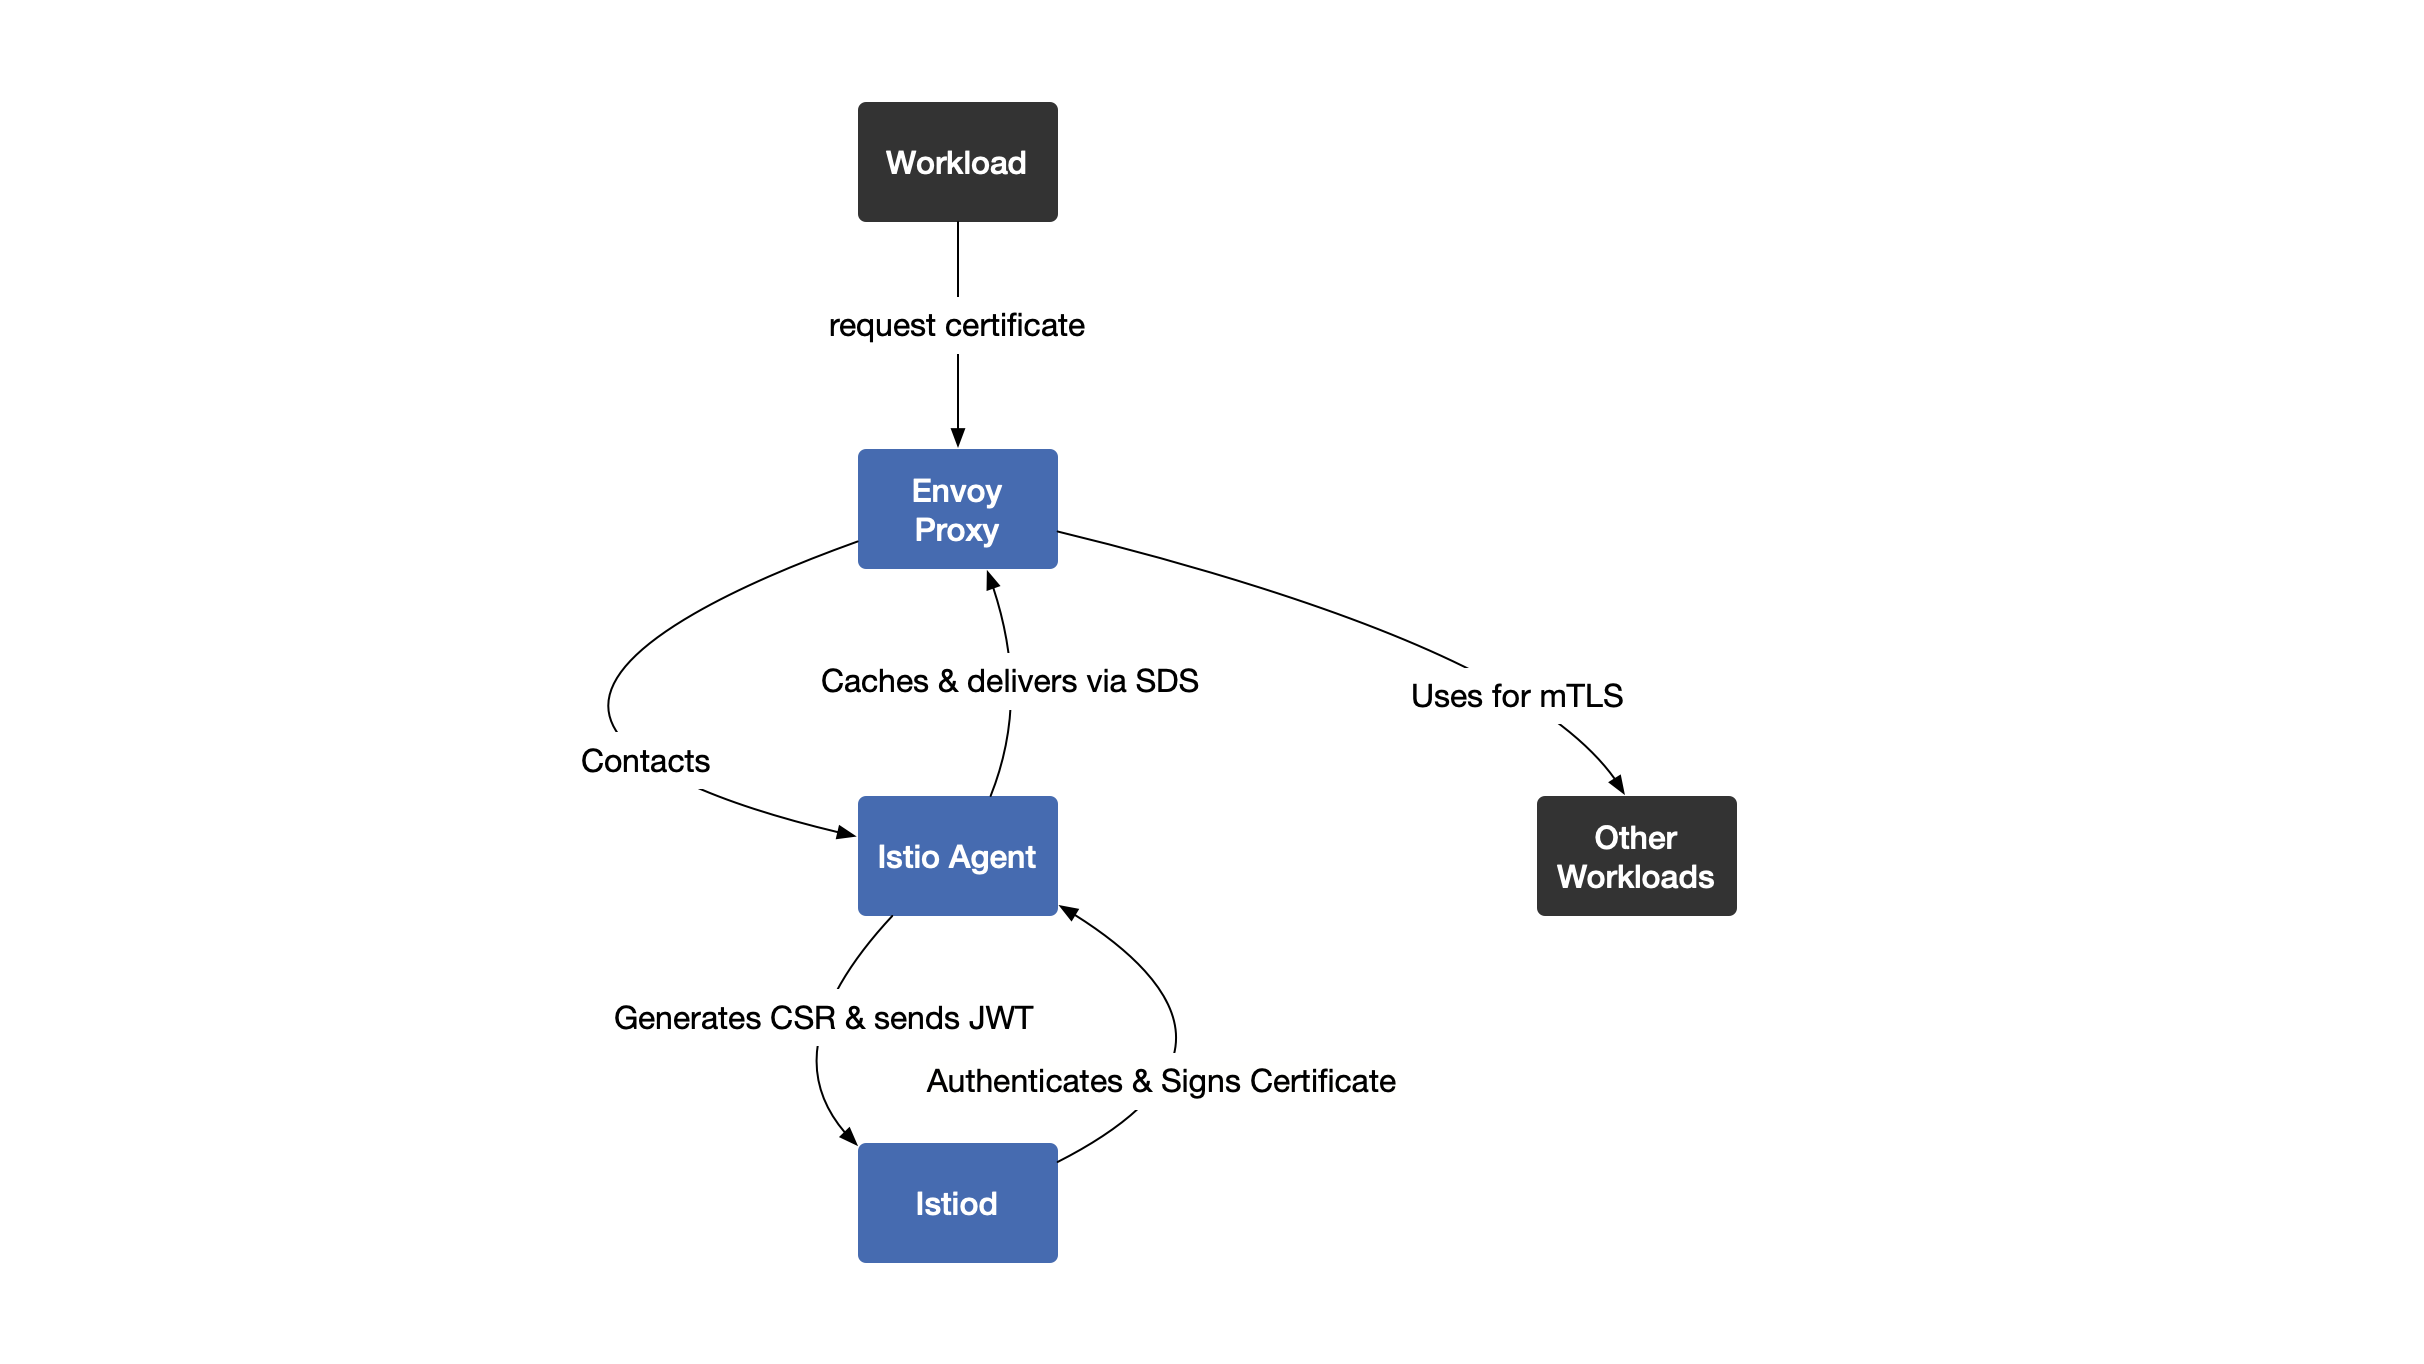
Step-by-step flow:
1. Workload starts
   ↓
2. Envoy proxy asks Istio Agent for certificate
   ↓
3. Istio Agent creates CSR (Certificate Signing Request)
   ↓
4. Istio Agent sends CSR + Service Account JWT to istiod
   ↓
5. Istiod verifies service account (authentication)
   ↓
6. Istiod signs and issues certificate
   ↓
7. Istio Agent caches certificate
   ↓
8. Istio Agent delivers certificate to Envoy via SDS
   ↓
9. Envoy uses certificate for mTLS communication
SDS = Secret Discovery Service (secure way to deliver certificates)
Certificate Rotation (Sidecar)
Automatic renewal:
- Istio Agent monitors certificate expiration
- Before expiration → Requests new certificate
- Seamless rotation (no downtime)
- Continuous security maintained
Like: Passport renewal before it expires
Ambient Mode - Certificate Management
Key Difference
No individual sidecars = Workloads don't run Envoy proxy
ztunnel handles everything = Shared L4 proxy per node manages certificates
Who Does What?
Three components:
-
ztunnel (per node)
- Shared Layer 4 proxy
- Handles mTLS for all workloads on node
- Manages certificates
- Validates identities
-
Istiod (Control Plane)
- Issues and signs certificates
- Same as sidecar mode
-
cert-manager (Optional)
- External CA integration
- For custom certificate authorities
How Certificate Issuance Works (Ambient)
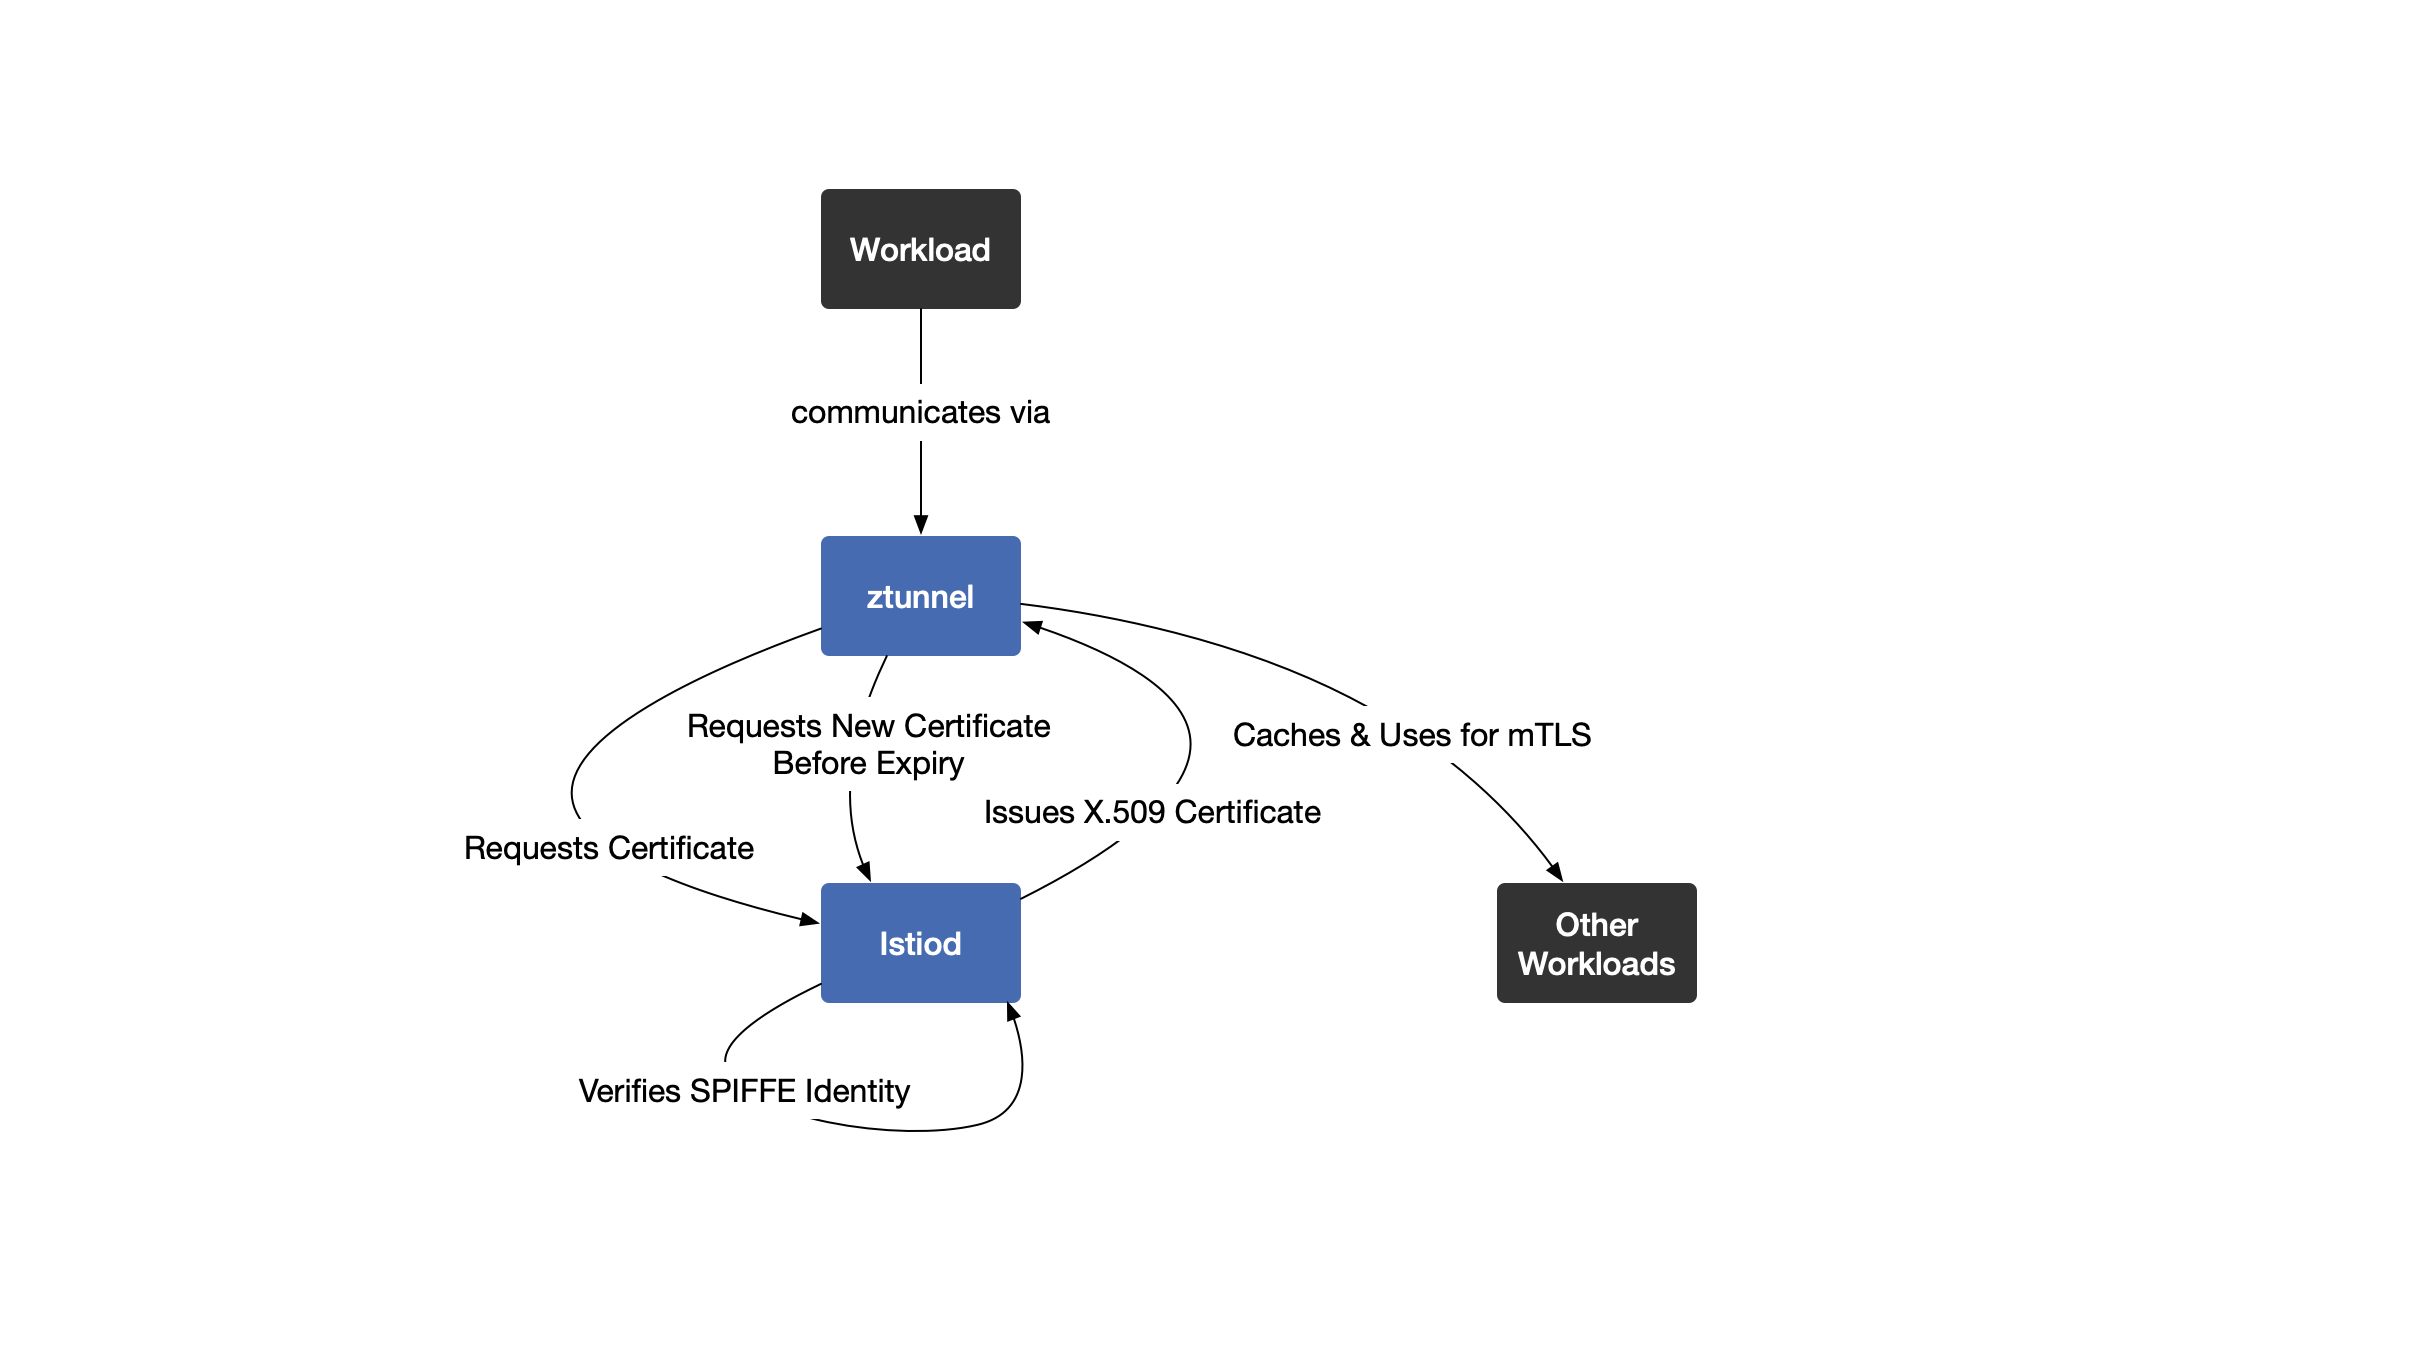
Step-by-step flow:
1. Workload starts
   ↓
2. Workload communicates through ztunnel
   ↓
3. ztunnel requests certificate from istiod (on behalf of workload)
   ↓
4. Istiod verifies SPIFFE identity
   ↓
5. Istiod issues X.509 certificate
   ↓
6. ztunnel caches certificate
   ↓
7. ztunnel uses certificate for mTLS communication
Key point: ztunnel acts as security boundary for workloads
Certificate Rotation (Ambient)
Automatic renewal:
- ztunnel monitors certificate expiration
- Before expiration → Requests new certificate from istiod
- Seamless rotation
- All workloads on node secured
Benefit: Lower resource overhead (one ztunnel per node, not per pod)
Sidecar vs Ambient Comparison
| Feature | Sidecar Mode | Ambient Mode |
|---|---|---|
| Certificate Issuance | Istiod → Workload certificate | Istiod → ztunnel certificate |
| mTLS Handling | Envoy per workload | ztunnel per node |
| Certificate Rotation | Istio Agent via SDS | ztunnel directly from istiod |
| Resource Overhead | Higher (proxy per pod) | Lower (shared proxy per node) |
| Identity Management | SPIFFE per workload | SPIFFE handled by ztunnel |
| Components | Istiod + Istio Agent + Envoy | Istiod + ztunnel |
Key Concepts Summary
| Concept | What It Is | Example |
|---|---|---|
| X.509 Certificate | Digital identity document | Digital passport |
| Certificate Authority (CA) | Issues certificates | Government issuing passports |
| CSR | Certificate Signing Request | Passport application |
| SDS | Secret Discovery Service | Secure delivery method |
| Rotation | Replacing old certificate | Passport renewal |
| Service Account JWT | Proof of identity | ID card for verification |
Certificate Lifecycle Timeline
Typical flow:
Day 1: Certificate issued (valid for 24 hours by default)
   ↓
Day 1 (12 hours): Istio starts monitoring expiration
   ↓
Day 1 (18 hours): Automatic renewal triggered
   ↓
Day 1 (18+ hours): New certificate issued
   ↓
Day 1 (19 hours): Old certificate replaced
   ↓
Day 2: New certificate active, cycle repeats
Default validity: 24 hours (configurable)
Renewal trigger: Before expiration (typically at 50% of lifetime)
Why Automatic Certificate Management Matters
Without automation:
- Manual certificate creation
- Manual renewal before expiration
- Risk of expired certificates (service outages)
- Complex management at scale
With Istio automation:
- Zero manual work
- No expired certificates
- Continuous security
- Scales to thousands of services
Like: Automatic passport renewal vs manual renewal every time
Important Points
Both modes use:
- SPIFFE identities (standard format)
- X.509 certificates (industry standard)
- Automatic rotation (no manual work)
Key difference:
- Sidecar: Each workload manages own certificate
- Ambient: ztunnel manages certificates for all workloads on node
Result: Secure communication without manual certificate management
Certificate management = Automatic creation, renewal, and rotation of digital identity documents
X.509 Certificate = Digital passport for services
Sidecar mode:
- Istio Agent requests certificates
- Envoy proxy uses certificates
- Per-workload management
Ambient mode:
- ztunnel requests and uses certificates
- Per-node management (lower overhead)
Automatic rotation = Certificates renewed before expiration (no downtime)
Components:
- Istiod = Certificate Authority (issues certificates)
- Istio Agent = Certificate manager (sidecar mode)
- ztunnel = Certificate manager (ambient mode)
- SDS = Secure delivery method
Default validity = 24 hours (auto-renewed)
Use for: Secure mTLS communication, zero-trust networking, automatic security
Peer and Request Authentication
Two Types of Authentication
Istio provides 2 authentication types:
- Peer Authentication = Service-to-service (machine-to-machine)
- Request Authentication = End-user authentication (user-to-service)
Both work in: Sidecar mode AND Ambient mode
Peer Authentication (Service-to-Service)
What is Peer Authentication?
Peer Authentication = Verifies identity of services talking to each other
Purpose: Ensures both client and server are who they claim to be
How: Uses mTLS (mutual TLS) with SPIFFE identities
Like: Two people showing IDs to each other before talking
mTLS Modes
Three modes available:
| Mode | What It Does | Use Case |
|---|---|---|
| STRICT | Only mTLS allowed (no plain text) | Production (most secure) |
| PERMISSIVE | Both mTLS and plain text allowed | Migration period |
| DISABLE | No mTLS (plain text only) | Testing only |
STRICT Mode (Production)
Configuration:
apiVersion: security.istio.io/v1
kind: PeerAuthentication
metadata:
  name: default
  namespace: default
spec:
  mtls:
    mode: STRICT
What this does:
- All communication MUST use mTLS
- Plain text traffic rejected
- Maximum security
- Use in production
Result: Services without valid certificates can't communicate
PERMISSIVE Mode (Migration)
Configuration:
apiVersion: security.istio.io/v1
kind: PeerAuthentication
metadata:
  name: default
  namespace: default
spec:
  mtls:
    mode: PERMISSIVE
What this does:
- Accepts BOTH mTLS and plain text
- Gradual migration to mTLS
- No service disruption
- Temporary mode
Use when: Migrating services to mTLS gradually
Like: Accepting both old and new passports during transition period
Request Authentication (End-User)
What is Request Authentication?
Request Authentication = Validates end-user credentials (not service identity)
Purpose: Verify actual users accessing services
How: Uses JWT (JSON Web Tokens) from identity providers
Like: Checking user login credentials
How It Works
Flow:
1. User logs in to identity provider (Google, Auth0, etc.)
   ↓
2. Identity provider issues JWT token
   ↓
3. User sends request with JWT in header
   ↓
4. Istio validates JWT
   ↓
5. If valid → Request allowed
6. If invalid → Request rejected
JWT Configuration
Configuration example:
apiVersion: security.istio.io/v1
kind: RequestAuthentication
metadata:
  name: jwt-auth
  namespace: default
spec:
  jwtRules:
  - issuer: "https://auth.example.com"
    jwksUri: "https://auth.example.com/.well-known/jwks.json"
Configuration breakdown:
- issuer: Who issued the JWT (identity provider URL)
- jwksUri: Where to get public keys to verify JWT
What this does: Only requests with valid JWT from auth.example.com are allowed
Common Identity Providers
Popular providers:
- Okta, Auth0, Google, Firebase, Keycloak, ORY Hydra, Azure AD
All work the same way: Issue JWT tokens that Istio validates
Peer vs Request Authentication
| Peer Authentication | Request Authentication | |
|---|---|---|
| Authenticates | Services (machines) | End users (people) |
| Uses | mTLS + SPIFFE | JWT tokens |
| Resource | PeerAuthentication | RequestAuthentication |
| Layer | Transport (L4) | Application (L7) |
| Example | Service A → Service B | User → Service |
| Like | Machine showing certificate | User showing login |
How It Works in Different Modes
Sidecar Mode
Peer Authentication:
- Envoy proxy handles mTLS
- Per-workload enforcement
- Each pod validates certificates
Request Authentication:
- Envoy proxy validates JWT
- Per-workload JWT checking
- HTTP-level validation
Who does it: Envoy sidecar proxy
Ambient Mode
Peer Authentication:
- ztunnel handles mTLS
- Node-level enforcement
- L4 (transport layer) validation
Request Authentication:
- Waypoint proxy validates JWT
- Namespace or service level
- L7 (application layer) validation
- Requires waypoint proxy for JWT validation
Who does it: ztunnel (L4) + waypoint proxy (L7)
Mode Comparison
| Feature | Sidecar Mode | Ambient Mode |
|---|---|---|
| Peer Auth (mTLS) | Envoy per pod | ztunnel per node |
| Request Auth (JWT) | Envoy per pod | Waypoint proxy |
| L4 Security | Sidecar | ztunnel |
| L7 Security | Sidecar | Waypoint proxy (required) |
Scope of Policies
Three scope levels:
-
Mesh-wide (istio-system namespace)
- Applies to entire mesh
- Default for all services
-
Namespace-level
- Applies to all services in namespace
- Overrides mesh-wide
-
Workload-specific
- Applies to specific service
- Most specific (highest priority)
Priority: Workload > Namespace > Mesh-wide
Common Patterns
Pattern 1: Mesh-wide STRICT mTLS
apiVersion: security.istio.io/v1
kind: PeerAuthentication
metadata:
  name: default
  namespace: istio-system  # Mesh-wide
spec:
  mtls:
    mode: STRICT
Use case: Enforce mTLS for entire mesh
Pattern 2: Namespace-level JWT
apiVersion: security.istio.io/v1
kind: RequestAuthentication
metadata:
  name: jwt-auth
  namespace: production  # Namespace-level
spec:
  jwtRules:
  - issuer: "https://auth.example.com"
    jwksUri: "https://auth.example.com/.well-known/jwks.json"
Use case: Require JWT for all services in production namespace
Pattern 3: Gradual mTLS Migration
Step 1: Start with PERMISSIVE
spec:
  mtls:
    mode: PERMISSIVE
Step 2: Monitor traffic (check if all services support mTLS)
Step 3: Switch to STRICT
spec:
  mtls:
    mode: STRICT
Safe migration: No service disruption
Key Concepts Summary
| Concept | What It Is | Example |
|---|---|---|
| Peer Authentication | Service-to-service auth | Service A ↔ Service B |
| Request Authentication | End-user auth | User → Service |
| mTLS | Mutual TLS encryption | Both sides show certificates |
| JWT | JSON Web Token | User login token |
| STRICT mode | Only mTLS allowed | Production security |
| PERMISSIVE mode | Both mTLS and plain text | Migration period |
| Issuer | Who issued JWT | Google, Auth0, etc. |
| jwksUri | Public key location | Verify JWT signature |
Important Notes
Peer Authentication:
- Automatic with Istio (no app code changes)
- Uses certificates managed by Istio
- Works at transport layer (L4)
Request Authentication:
- Requires external identity provider
- App must send JWT in request
- Works at application layer (L7)
Ambient mode JWT:
- Requires waypoint proxy
- ztunnel only handles L4 (mTLS)
- Waypoint handles L7 (JWT)
When to Use What?
Use Peer Authentication when:
- Securing service-to-service communication
- Zero-trust networking
- Internal mesh security
Use Request Authentication when:
- Validating end users
- External API access
- User-facing services
Use both when:
- Need both service and user authentication
- Maximum security required
- Production environments
Two authentication types:
- Peer Authentication = Service-to-service (mTLS)
- Request Authentication = End-user (JWT)
Peer Authentication:
- Uses mTLS with SPIFFE identities
- Three modes: STRICT (production), PERMISSIVE (migration), DISABLE (testing)
- Resource: PeerAuthentication
Request Authentication:
- Uses JWT tokens from identity providers
- Validates end-user credentials
- Resource: RequestAuthentication
Sidecar mode: Envoy handles both
Ambient mode: ztunnel (mTLS) + waypoint proxy (JWT)
Scope levels: Mesh-wide > Namespace > Workload
Use for: Secure service communication (peer) + user validation (request)
Mutual TLS (mTLS)
What is mTLS?
Mutual TLS (mTLS) = Both client and server show certificates to each other
Purpose: Secure communication between services
Like: Two people showing IDs to each other (not just one)
Works in: Both Sidecar mode AND Ambient mode
How mTLS Works
Step-by-Step Process
1. Service A wants to talk to Service B
   ↓
2. Traffic goes through proxy (Envoy or ztunnel)
   ↓
3. Client proxy starts mTLS handshake with server proxy
   ↓
4. Both proxies present X.509 certificates
   ↓
5. Both verify SPIFFE identities in certificates
   ↓
6. Client checks if server's service account is authorized
   ↓
7. Encrypted communication channel established
   ↓
8. Request forwarded to destination
Key point: Both sides authenticate each other (mutual)
mTLS in Different Modes
Sidecar Mode
Who handles it: Envoy proxy (sidecar next to each workload)
How:
- Each workload has own Envoy proxy
- Proxy handles mTLS encryption
- Proxy handles authentication
- Per-workload level security
Like: Each person has own security guard
Ambient Mode
Who handles it: ztunnel (shared L4 proxy per node)
How:
- ztunnel transparently encrypts traffic
- ztunnel authenticates traffic
- Node-level security
- No sidecar needed
Like: Shared security checkpoint for everyone on same floor
mTLS Modes
Three modes available:
| Mode | What It Does | When to Use |
|---|---|---|
| STRICT | Only mTLS (no plain text) | Production |
| PERMISSIVE | Both mTLS and plain text | Migration |
| DISABLE | No mTLS (plain text only) | Testing |
Configuring mTLS with PeerAuthentication
STRICT Mode (Production)
Configuration:
apiVersion: security.istio.io/v1
kind: PeerAuthentication
metadata:
  name: default
  namespace: default
spec:
  mtls:
    mode: STRICT
What this does:
- All communication MUST use mTLS
- Plain text rejected
- Maximum security
Scope: All services in default namespace
PERMISSIVE Mode (Migration)
Configuration:
apiVersion: security.istio.io/v1
kind: PeerAuthentication
metadata:
  name: default
  namespace: default
spec:
  mtls:
    mode: PERMISSIVE
What this does:
- Accepts both mTLS and plain text
- Services with mTLS → Use mTLS
- Services without mTLS → Use plain text
- Gradual migration
Use when: Migrating services to mTLS one by one
Global mTLS (Entire Mesh)
Configuration:
apiVersion: security.istio.io/v1
kind: PeerAuthentication
metadata:
  name: global-mtls
  namespace: istio-system  # Important: istio-system for mesh-wide
spec:
  mtls:
    mode: STRICT
What this does:
- Enforces mTLS for ENTIRE mesh
- All namespaces affected
- All services must use mTLS
Scope: Mesh-wide (all namespaces)
Configuring mTLS with DestinationRule
Purpose: Control TLS for outgoing traffic to specific service
Configuration:
apiVersion: networking.istio.io/v1
kind: DestinationRule
metadata:
  name: example-destination
  namespace: default
spec:
  host: example-service.default.svc.cluster.local
  trafficPolicy:
    tls:
      mode: ISTIO_MUTUAL
What this does: Use Istio-managed mTLS when calling example-service
TLS Modes in DestinationRule
Four modes available:
| Mode | What It Does | Use Case |
|---|---|---|
| DISABLE | No TLS (plain text) | Testing only |
| SIMPLE | TLS without client auth | One-way TLS |
| MUTUAL | mTLS with manual certs | Custom certificates |
| ISTIO_MUTUAL | mTLS with Istio certs | Recommended (automatic) |
Recommended: Use ISTIO_MUTUAL (Istio manages certificates automatically)
PeerAuthentication vs DestinationRule
| PeerAuthentication | DestinationRule | |
|---|---|---|
| Controls | Incoming traffic (server side) | Outgoing traffic (client side) |
| Enforces | What server accepts | What client sends |
| Scope | Mesh/Namespace/Workload | Specific service |
| Example | "I only accept mTLS" | "I will use mTLS when calling you" |
Both needed: PeerAuthentication (server) + DestinationRule (client) for complete mTLS
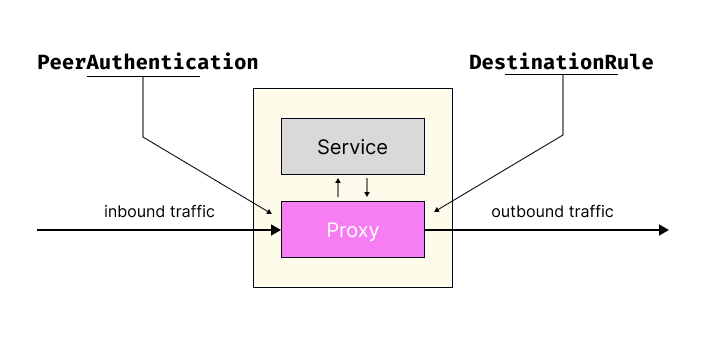
Scope Levels
Three scope levels:
-
Mesh-wide (istio-system namespace)
namespace: istio-system- Applies to entire mesh
- All namespaces
-
Namespace-level (specific namespace)
namespace: production- Applies to all services in namespace
- Overrides mesh-wide
-
Workload-specific (with selector)
selector:
  matchLabels:
app: frontend- Applies to specific service
- Highest priority
Priority: Workload > Namespace > Mesh-wide
Migration Strategy
Safe migration to STRICT mTLS:
Step 1: Start with PERMISSIVE
spec:
  mtls:
    mode: PERMISSIVE
Step 2: Monitor traffic
- Check which services use mTLS
- Check which services use plain text
- Identify services that need updates
Step 3: Update services gradually
- Ensure all services support mTLS
- Test each service
Step 4: Switch to STRICT
spec:
  mtls:
    mode: STRICT
Step 5: Verify
- All traffic encrypted
- No plain text connections
Result: Zero-downtime migration
Common Patterns
Pattern 1: Mesh-wide STRICT mTLS
apiVersion: security.istio.io/v1
kind: PeerAuthentication
metadata:
  name: global-mtls
  namespace: istio-system
spec:
  mtls:
    mode: STRICT
Use case: Production mesh with maximum security
Pattern 2: Namespace PERMISSIVE for Migration
apiVersion: security.istio.io/v1
kind: PeerAuthentication
metadata:
  name: default
  namespace: staging
spec:
  mtls:
    mode: PERMISSIVE
Use case: Staging environment during migration
Pattern 3: Workload-specific STRICT
apiVersion: security.istio.io/v1
kind: PeerAuthentication
metadata:
  name: frontend-mtls
  namespace: default
spec:
  selector:
    matchLabels:
      app: frontend
  mtls:
    mode: STRICT
Use case: Enforce mTLS for specific critical service
Key Concepts Summary
| Concept | What It Is | Example |
|---|---|---|
| mTLS | Both sides show certificates | Mutual authentication |
| STRICT | Only mTLS allowed | Production mode |
| PERMISSIVE | Both mTLS and plain text | Migration mode |
| DISABLE | No mTLS | Testing only |
| ISTIO_MUTUAL | Istio-managed mTLS | Recommended |
| PeerAuthentication | Server-side policy | What I accept |
| DestinationRule | Client-side policy | What I send |
How It Works in Practice
Example scenario:
Setup:
- Service A wants to call Service B
- Both in mesh with STRICT mTLS
What happens:
1. Service A makes request to Service B
   ↓
2. Request intercepted by proxy (Envoy/ztunnel)
   ↓
3. Proxy A initiates mTLS handshake with Proxy B
   ↓
4. Proxy A presents certificate (proves identity)
   ↓
5. Proxy B presents certificate (proves identity)
   ↓
6. Both verify certificates (SPIFFE identities)
   ↓
7. Encrypted channel established
   ↓
8. Request forwarded to Service B
   ↓
9. Response encrypted and sent back
Result: Secure, encrypted communication
Important Notes
Automatic with Istio:
- No app code changes needed
- Certificates managed automatically
- Rotation handled automatically
Both modes supported:
- Sidecar: Envoy handles mTLS
- Ambient: ztunnel handles mTLS
Same policies:
- PeerAuthentication works in both modes
- DestinationRule works in both modes
Troubleshooting
Problem: Services can't communicate after enabling STRICT
Possible causes:
- Service doesn't have sidecar injected (sidecar mode)
- Namespace not labeled for ambient (ambient mode)
- Certificate issues
- Conflicting policies
Solution: Check pod status, labels, and policies
Best Practices
Production:
- Use STRICT mode
- Apply mesh-wide policy
- Monitor certificate expiration
Migration:
- Start with PERMISSIVE
- Migrate gradually
- Test thoroughly
- Switch to STRICT when ready
Configuration:
- Use ISTIO_MUTUAL in DestinationRule
- Let Istio manage certificates
- Don't use DISABLE in production
mTLS = Mutual TLS where both client and server authenticate each other
Three modes:
- STRICT = Only mTLS (production)
- PERMISSIVE = Both mTLS and plain text (migration)
- DISABLE = No mTLS (testing)
Two resources:
- PeerAuthentication = Server-side (what I accept)
- DestinationRule = Client-side (what I send)
Scope levels: Mesh-wide > Namespace > Workload
Works in both modes:
- Sidecar: Envoy handles mTLS per workload
- Ambient: ztunnel handles mTLS per node
Automatic: Istio manages certificates, rotation, and encryption
Migration: PERMISSIVE → Monitor → STRICT (zero downtime)
Recommended: Use ISTIO_MUTUAL mode (Istio-managed certificates)
Use for: Secure service-to-service communication, zero-trust networking
Lab: Enable mTLS
What This Lab Does
Goal: See how mTLS works in practice
Setup:
- Deploy web-frontend WITHOUT sidecar (plain text)
- Deploy customers service WITH sidecar (mTLS capable)
- Test PERMISSIVE mode (both work)
- Test STRICT mode (plain text fails)
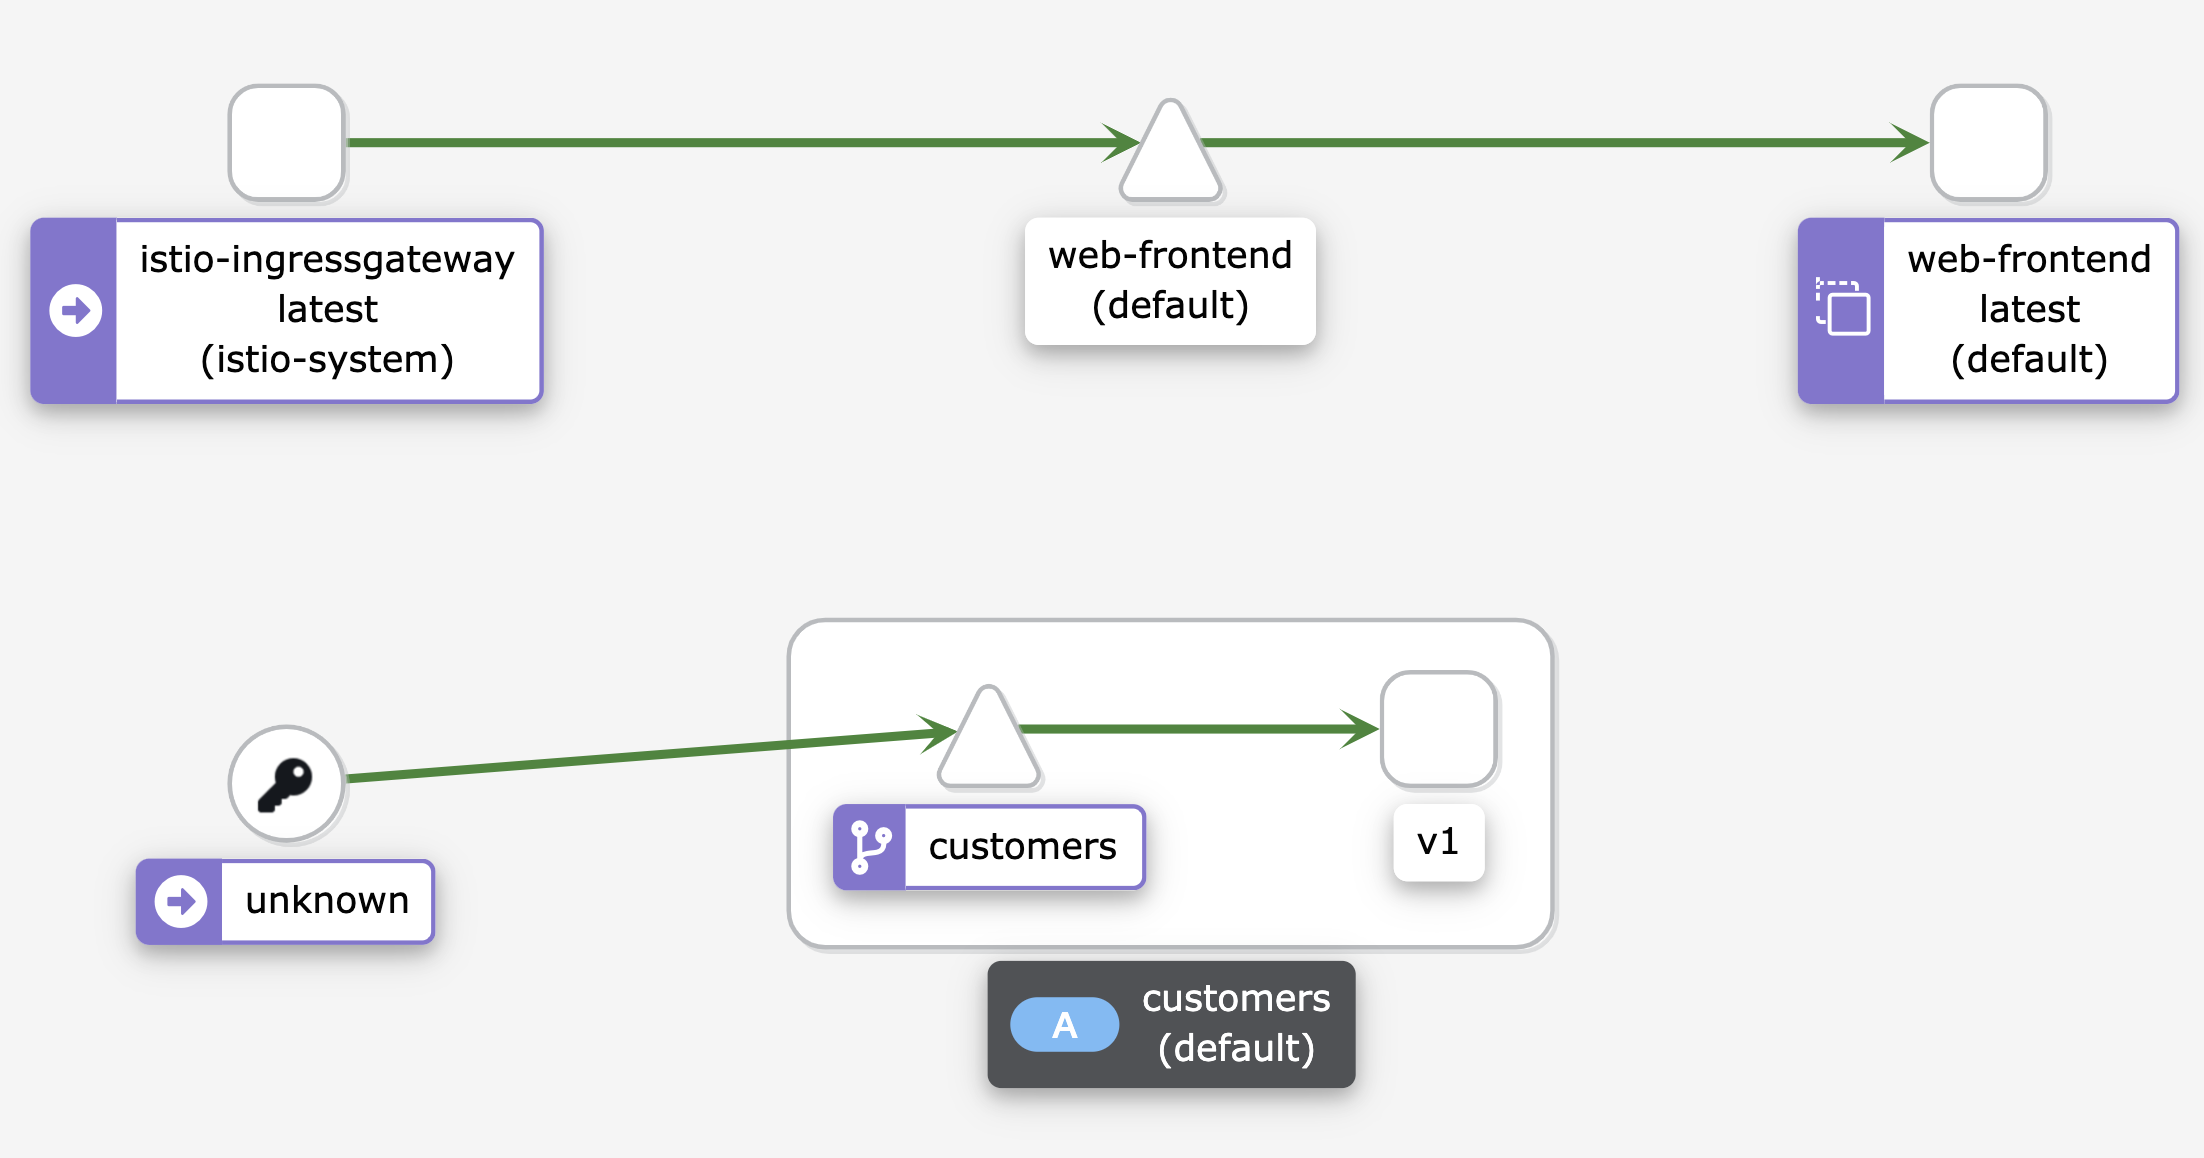
Lab Steps
Step 1: Deploy Gateway
kubectl apply -f gateway.yaml
Step 2: Disable Auto-Injection
kubectl label namespace default istio-injection-
Why: We want web-frontend WITHOUT sidecar
Step 3: Deploy Web Frontend (No Sidecar)
kubectl apply -f web-frontend.yaml
kubectl get pods  # Shows 1/1 READY
Step 4: Enable Auto-Injection
kubectl label namespace default istio-injection=enabled
Step 5: Deploy Customers Service (With Sidecar)
kubectl apply -f customers-v1.yaml
kubectl get pods  # Shows customers 2/2, web-frontend 1/1
Step 6: Test PERMISSIVE Mode
curl http://$GATEWAY_URL # Works!
Why works: PERMISSIVE allows plain text
Step 7: Check Kiali
istioctl dashboard kiali
Enable Security view: Display → Check "Security"
See:
- 🔒 Padlock: Ingress → Customers (mTLS)
- ❌ No padlock: Ingress → Web-frontend (plain text)
Step 8: Enable STRICT mTLS
kubectl apply -f strict-mtls.yaml
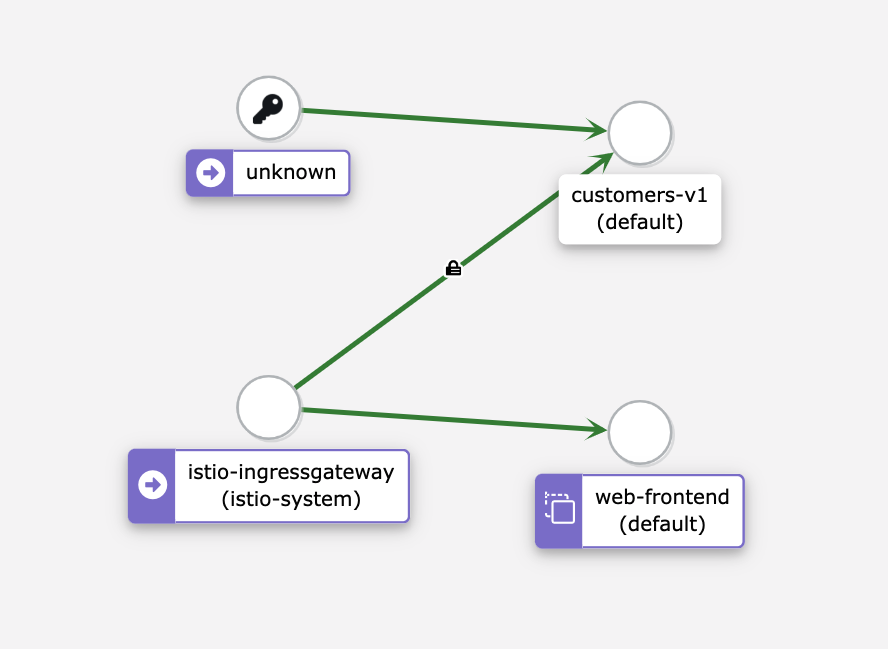
Result: Web-frontend → Customers FAILS (ECONNRESET)
Why: Web-frontend has no sidecar, can't do mTLS
Step 9: Revert
kubectl delete peerauthentication default
Ambient Mode Version
# Enable ambient
kubectl label namespace default istio.io/dataplane-mode=ambient

# Deploy services (no sidecars)
kubectl apply -f web-frontend.yaml
kubectl apply -f customers-v1.yaml

# Enable STRICT
kubectl apply -f strict-mtls.yaml

# Test - Works! ztunnel handles mTLS
curl http://$GATEWAY_URL
What You Learned
PERMISSIVE: Both mTLS and plain text work
STRICT: Only mTLS works, plain text fails
Sidecar mode: Need sidecar for mTLS (2/2 READY)
Ambient mode: ztunnel handles mTLS automatically (1/1 READY)
PERMISSIVE = Migration friendly (accepts both)
STRICT = Production secure (only mTLS)
Without sidecar = No mTLS (fails in STRICT)
Ambient mode = mTLS without sidecars (ztunnel)
Kiali = Visual mTLS status (padlock icon)
Authorization
What is Authorization?
Authorization decides if an authenticated user/service is allowed to do something - like checking if you have permission to enter a room after showing your ID.
Enforced using: AuthorizationPolicy resource
Works in: Both sidecar and ambient modes
How Authorization Works by Mode
Sidecar Mode
Proxy: Envoy sidecar per pod
Enforcement:
- L4 (Layer 4): IP, port, service identity
- L7 (Layer 7): HTTP methods, paths, headers
Example: Can control GET vs POST, /api/users vs /admin
Ambient Mode
Two components:
| Component | Layer | What It Controls |
|---|---|---|
| ztunnel | L4 | IP, port, service identity |
| waypoint proxy | L7 | HTTP methods, paths, headers |
Important: Without waypoint proxy, only L4 policies work!
Issue: Waypoint proxy acts as the caller when forwarding requests
Result: Original caller identity may be hidden
Solution: Attach policy to waypoint proxy to preserve source identity
Three Parts of AuthorizationPolicy
1. Selector
What: Which workloads this policy applies to
Example:
selector:
  matchLabels:
    app: customers
Meaning: Apply to all pods with label app: customers
2. Action
What: What to do with matching requests
| Action | What It Does | Use Case |
|---|---|---|
| ALLOW | Let request through | Grant access |
| DENY | Block request | Restrict access |
| AUDIT | Log request (don't block) | Monitor activity |
3. Rules
What: Conditions that must match
Three types:
- source: Who is making the request
- operation: What they want to do (GET, POST, path)
- conditions: Extra checks (headers, IP address)
Example: Allow GET Requests
apiVersion: security.istio.io/v1
kind: AuthorizationPolicy
metadata:
  name: allow-customers-get
  namespace: default
spec:
  selector:
    matchLabels:
      app: customers
  action: ALLOW
  rules:
  - from:
    - source:
        namespaces: ["default"]
    to:
    - operation:
        methods: ["GET"]
What this does:
- Applies to:
customersservice - Allows: GET requests
- From: Services in
defaultnamespace - Blocks: Everything else (POST, DELETE, etc.)
Enforcement:
- Sidecar mode: Envoy proxy enforces at L7
- Ambient mode: Waypoint proxy enforces at L7 (needs waypoint!)
Policy Evaluation Order
Istio checks policies in this order:
1. CUSTOM policies
   ↓ (if any deny → request denied)
2. DENY policies
   ↓ (if any match → request denied)
3. ALLOW policies
   ↓ (if none exist → request allowed)
   ↓ (if any match → request allowed)
4. Default DENY
   ↓ (no match → request denied)
Key point: DENY wins over ALLOW
Policy Evaluation Examples
Scenario 1: No Policies
Result: Request ALLOWED (default allow)
Scenario 2: Only ALLOW Policy Exists
If matches: Request ALLOWED
If doesn't match: Request DENIED (default deny when ALLOW exists)
Scenario 3: DENY Policy Exists
If matches: Request DENIED (DENY wins)
If doesn't match: Check ALLOW policies
Source Matching
Purpose: Specify WHO can make requests
Common Source Fields
| Field | Example | Meaning |
|---|---|---|
| principals | ["my-service-account"] | Workload using this service account |
| notPrincipals | ["my-service-account"] | Any workload EXCEPT this |
| requestPrincipals | ["my-issuer/hello"] | Workload with valid JWT token |
| notRequestPrincipals | ["*"] | Workload without JWT |
| namespaces | ["default"] | From default namespace |
| notNamespaces | ["prod"] | NOT from prod namespace |
| ipBlocks | ["1.2.3.4", "9.8.7.6/15"] | From specific IP or CIDR |
| notIpBlocks | ["1.2.3.4/24"] | NOT from this CIDR block |
Source Examples
Example 1: Allow from Namespace
rules:
- from:
  - source:
      namespaces: ["default"]
Meaning: Only allow requests from default namespace
Example 2: Block from Namespace
rules:
- from:
  - source:
      notNamespaces: ["prod"]
Meaning: Block requests from prod namespace
Example 3: Allow Specific Service Account
rules:
- from:
  - source:
      principals: ["cluster.local/ns/default/sa/web-frontend"]
Meaning: Only allow requests from web-frontend service account
Example 4: Allow from IP Range
rules:
- from:
  - source:
      ipBlocks: ["10.0.0.0/16"]
Meaning: Only allow requests from IPs in 10.0.0.0/16 range
Operations
Purpose: Specify WHAT action is being requested
Defined under: to field
Multiple operations: Use AND logic (all must match)
Operation Fields
| Field | Negative Match | Example |
|---|---|---|
| hosts | notHosts | ["example.com"] |
| ports | notPorts | ["8080"] |
| methods | notMethods | ["GET", "POST"] |
| paths | notPaths | ["/api/*", "/admin"] |
Operation Examples
Example 1: Allow GET on Specific Path
rules:
- to:
  - operation:
      methods: ["GET"]
      paths: ["/api/users"]
Meaning: Only allow GET requests to /api/users
Example 2: Allow Specific Port
rules:
- to:
  - operation:
      ports: ["8080"]
Meaning: Only allow requests to port 8080
Example 3: Block Admin Path
rules:
- to:
  - operation:
      notPaths: ["/admin/*"]
Meaning: Block all requests to /admin/* paths
Example 4: Allow Multiple Paths
rules:
- to:
  - operation:
      methods: ["GET"]
      paths: ["/api/*", "/health"]
Meaning: Allow GET to /api/* OR /health
Conditions
Purpose: Extra checks using Istio attributes
Defined under: when field
Two parts:
- key: Istio attribute name
- values or notValues: List of values to match
Common Condition Keys
| Key | What It Checks | Example |
|---|---|---|
request.headers | HTTP headers | ["x-api-key"] |
source.ip | Source IP address | ["10.0.1.1"] |
destination.port | Destination port | ["8080"] |
request.auth.claims | JWT claims | ["admin"] |
Full list: Authorization Policy Conditions
Condition Examples
Example 1: Block Specific IP
rules:
- when:
  - key: source.ip
    notValues: ["10.0.1.1"]
Meaning: Block requests from IP 10.0.1.1
Example 2: Require Header
rules:
- when:
  - key: request.headers[x-api-key]
    values: ["secret-key-123"]
Meaning: Only allow if header x-api-key: secret-key-123 present
Example 3: Check JWT Claim
rules:
- when:
  - key: request.auth.claims[role]
    values: ["admin"]
Meaning: Only allow if JWT has role: admin claim
Complete Example: Complex Policy
apiVersion: security.istio.io/v1
kind: AuthorizationPolicy
metadata:
  name: complex-policy
  namespace: default
spec:
  selector:
    matchLabels:
      app: customers
  action: ALLOW
  rules:
  - from:
    - source:
        namespaces: ["default"]
        principals: ["cluster.local/ns/default/sa/web-frontend"]
    to:
    - operation:
        methods: ["GET"]
        paths: ["/api/customers/*"]
    when:
    - key: request.headers[x-api-version]
      values: ["v1"]
What this does:
- Applies to:
customersservice - Allows: Requests that match ALL of:
- From
defaultnamespace - Using
web-frontendservice account - GET method
- Path starts with
/api/customers/ - Header
x-api-version: v1present
- From
- Blocks: Everything else
Flow:
1. Authentication: Verify identity
↓
2. Authorization: Check permissions
↓
3. Allow or deny request
Common Patterns
Pattern 1: Default Deny All
apiVersion: security.istio.io/v1
kind: AuthorizationPolicy
metadata:
name: deny-all
namespace: default
spec: {}
What this does: Deny all requests (empty spec = no ALLOW rules)
Use case: Start with deny-all, then add specific ALLOW policies
Pattern 2: Allow from Same Namespace
apiVersion: security.istio.io/v1
kind: AuthorizationPolicy
metadata:
name: allow-same-namespace
namespace: default
spec:
action: ALLOW
rules:
- from:
- source:
namespaces: ["default"]
Use case: Services can only talk within same namespace
Pattern 3: Read-Only Access
apiVersion: security.istio.io/v1
kind: AuthorizationPolicy
metadata:
name: read-only
namespace: default
spec:
selector:
matchLabels:
app: customers
action: ALLOW
rules:
- to:
- operation:
methods: ["GET", "HEAD"]
Use case: Allow only read operations (GET, HEAD)
Pattern 4: Block External Access
apiVersion: security.istio.io/v1
kind: AuthorizationPolicy
metadata:
name: block-external
namespace: default
spec:
selector:
matchLabels:
app: internal-service
action: DENY
rules:
- from:
- source:
notNamespaces: ["default", "production"]
Use case: Block access from outside specific namespaces
Troubleshooting
Problem: All Requests Denied
Possible causes:
- ALLOW policy exists but doesn't match
- DENY policy matches
- Empty AuthorizationPolicy (deny-all)
Solution: Check policy rules, add logging
Problem: Policy Not Working
Possible causes:
- Wrong namespace
- Wrong selector
- L7 policy without waypoint (ambient mode)
- Policy not applied yet
Solution: Verify namespace, selector, and waypoint deployment
Problem: Source Identity Lost (Ambient Mode)
Cause: Waypoint proxy acts as caller
Solution: Attach policy to waypoint proxy instead of destination
Best Practices
Start with deny-all:
spec: {} # Empty = deny all
Then add specific ALLOW policies
Use namespace isolation:
- Separate namespaces for different environments
- Use namespace-based policies
Principle of least privilege:
- Only allow what's needed
- Use specific paths and methods
Test in PERMISSIVE first:
- Use AUDIT action to test
- Monitor logs before enforcing
Use service accounts:
- Better than IP-based policies
- Works across network changes
Key Concepts Summary
| Concept | What It Is | Example |
|---|---|---|
| Authorization | Permission check | Can you access /api? |
| AuthorizationPolicy | Policy resource | YAML config |
| Selector | Which workloads | app: customers |
| Action | What to do | ALLOW, DENY, AUDIT |
| Source | Who makes request | Namespace, IP, service account |
| Operation | What is requested | GET /api/users |
| Condition | Extra checks | Header, JWT claim |
| L4 | Network layer | IP, port |
| L7 | Application layer | HTTP method, path |
Mode Comparison
| Feature | Sidecar Mode | Ambient Mode |
|---|---|---|
| L4 enforcement | Envoy sidecar | ztunnel |
| L7 enforcement | Envoy sidecar | waypoint proxy |
| Requires waypoint | ❌ No | ✅ Yes (for L7) |
| Source identity | Always preserved | May be hidden by waypoint |
| Policy location | Per workload | Per namespace/service |
Authorization = Permission check (what can you do?)
AuthorizationPolicy = YAML config with 3 parts:
- Selector = Which workloads
- Action = ALLOW, DENY, or AUDIT
- Rules = Source + Operation + Conditions
Evaluation order: CUSTOM → DENY → ALLOW → Default DENY
Source = WHO (namespace, IP, service account)
Operation = WHAT (method, path, port)
Condition = EXTRA CHECKS (headers, JWT claims)
Scope levels: Workload > Namespace > Mesh-wide
Sidecar mode: Envoy enforces L4 + L7
Ambient mode: ztunnel (L4) + waypoint (L7)
Important: L7 policies need waypoint proxy in ambient mode!
Best practice: Start with deny-all, add specific ALLOW policies
Use for: Access control, security policies, zero-trust networking
Lab 2: Access Control
What This Lab Does
Goal: Use AuthorizationPolicy to control traffic between workloads
Two parts:
- Sidecar mode
- Ambient mode
Part 1: Sidecar Mode
Step 1: Deploy Ingress Gateway
apiVersion: networking.istio.io/v1
kind: Gateway
metadata:
name: gateway
spec:
selector:
istio: ingressgateway
servers:
- port:
number: 80
name: http
protocol: HTTP
hosts:
- '*'
kubectl apply -f gateway.yaml
Step 2: Deploy Services
web-frontend.yaml:
apiVersion: v1
kind: ServiceAccount
metadata:
name: web-frontend
---
apiVersion: apps/v1
kind: Deployment
metadata:
name: web-frontend
spec:
replicas: 1
selector:
matchLabels:
app: web-frontend
template:
metadata:
labels:
app: web-frontend
spec:
serviceAccountName: web-frontend
containers:
- image: gcr.io/tetratelabs/web-frontend:1.0.0
name: web
ports:
- containerPort: 8080
env:
- name: CUSTOMER_SERVICE_URL
value: 'http://customers.default.svc.cluster.local'
---
apiVersion: v1
kind: Service
metadata:
name: web-frontend
spec:
selector:
app: web-frontend
ports:
- port: 80
targetPort: 8080
---
apiVersion: networking.istio.io/v1
kind: VirtualService
metadata:
name: web-frontend
spec:
hosts:
- '*'
gateways:
- gateway
http:
- route:
- destination:
host: web-frontend.default.svc.cluster.local
port:
number: 80
customers-v1.yaml:
apiVersion: v1
kind: ServiceAccount
metadata:
name: customers-v1
---
apiVersion: apps/v1
kind: Deployment
metadata:
name: customers-v1
spec:
replicas: 1
selector:
matchLabels:
app: customers
template:
metadata:
labels:
app: customers
spec:
serviceAccountName: customers-v1
containers:
- image: gcr.io/tetratelabs/customers:1.0.0
name: svc
ports:
- containerPort: 3000
---
apiVersion: v1
kind: Service
metadata:
name: customers
spec:
selector:
app: customers
ports:
- port: 80
targetPort: 3000
---
apiVersion: networking.istio.io/v1
kind: VirtualService
metadata:
name: customers
spec:
hosts:
- 'customers.default.svc.cluster.local'
http:
- route:
- destination:
host: customers.default.svc.cluster.local
port:
number: 80
kubectl apply -f web-frontend.yaml
kubectl apply -f customers.yaml
Step 3: Verify Access
minikube tunnel
curl -v -H "Host: customers.default.svc.cluster.local" http://127.0.0.1
Result: Should see customers data
Step 4: Deny All Traffic
apiVersion: security.istio.io/v1
kind: AuthorizationPolicy
metadata:
name: deny-all
namespace: default
spec: {}
kubectl apply -f deny-all.yaml
Result:
curl -v -H "Host: customers.default.svc.cluster.local" http://127.0.0.1
# RBAC: access denied
kubectl run curl --image=curlimages/curl:latest --command -- /bin/sh -c "sleep infinity"
kubectl exec -it curl -- curl customers
# RBAC: access denied
Step 5: Allow Specific Traffic
Allow Ingress Gateway → Web Frontend:
apiVersion: security.istio.io/v1
kind: AuthorizationPolicy
metadata:
name: allow-ingress-frontend
spec:
selector:
matchLabels:
app: web-frontend
action: ALLOW
rules:
- from:
- source:
principals:
- "cluster.local/ns/istio-system/sa/istio-ingressgateway-service-account"
Allow Web Frontend → Customers:
apiVersion: security.istio.io/v1
kind: AuthorizationPolicy
metadata:
name: allow-web-frontend-customers
spec:
selector:
matchLabels:
app: customers
action: ALLOW
rules:
- from:
- source:
principals:
- "cluster.local/ns/default/sa/web-frontend"
kubectl apply -f allow-ingress-frontend.yaml
kubectl apply -f allow-web-frontend-customers.yaml
Final Result:
- Ingress Gateway → Web Frontend → Customers: ALLOWED
- Other traffic: DENIED
Step 6: Cleanup (Sidecar)
kubectl delete authorizationpolicy --all
kubectl delete gateway gateway
kubectl delete virtualservice web-frontend customers
kubectl delete deploy web-frontend customers-v1
kubectl delete service web-frontend customers
kubectl delete serviceaccount web-frontend customers-v1
kubectl delete pod curl
Part 2: Ambient Mode
Step 1: Install Ambient Mode
istioctl install --set profile=ambient --skip-confirmation
kubectl label namespace default istio.io/dataplane-mode=ambient
kubectl apply -f https://github.com/kubernetes-sigs/gateway-api/releases/download/v1.2.1/standard-install.yaml
Step 2: Deploy Services
kubectl apply -f web-frontend.yaml
kubectl apply -f customers.yaml
# Delete old VirtualService
kubectl delete virtualservice web-frontend
Why: Use HTTPRoute instead in ambient mode
Step 3: Deploy Gateway and Waypoint
Gateway API:
apiVersion: gateway.networking.k8s.io/v1
kind: Gateway
metadata:
name: ingress-gateway
namespace: default
spec:
gatewayClassName: istio
listeners:
- name: http
protocol: HTTP
port: 80
allowedRoutes:
namespaces:
from: Same
kubectl apply -f gateway-api.yaml
Waypoint Proxy:
istioctl waypoint apply -n default
Step 4: Create HTTPRoute
apiVersion: gateway.networking.k8s.io/v1
kind: HTTPRoute
metadata:
name: web-frontend
namespace: default
spec:
parentRefs:
- name: ingress-gateway
hostnames:
- "customers.default.svc.cluster.local"
rules:
- backendRefs:
- name: web-frontend
port: 80
kubectl apply -f httproute.yaml
Step 5: Deny All Traffic
apiVersion: security.istio.io/v1
kind: AuthorizationPolicy
metadata:
name: deny-all
namespace: ambient
spec: {}
kubectl apply -f deny-all.yaml
Result:
curl: (56) Recv failure: Connection reset by peer
Step 6: Allow Specific Traffic
Allow All → Ingress Gateway:
apiVersion: security.istio.io/v1
kind: AuthorizationPolicy
metadata:
name: allow-ingress-gateway
namespace: default
spec:
targetRefs:
- kind: Gateway
name: ingress-gateway
rules:
- {}
Allow Ingress Gateway → Web Frontend:
apiVersion: security.istio.io/v1
kind: AuthorizationPolicy
metadata:
name: allow-ingress-frontend
namespace: default
spec:
selector:
matchLabels:
app: web-frontend
action: ALLOW
rules:
- from:
- source:
principals:
- "cluster.local/ns/default/sa/ingress-gateway-istio"
Allow Web Frontend + Waypoint → Customers:
apiVersion: security.istio.io/v1
kind: AuthorizationPolicy
metadata:
name: allow-web-frontend-customers
namespace: default
spec:
selector:
matchLabels:
app: customers
action: ALLOW
rules:
- from:
- source:
principals:
- "cluster.local/ns/default/sa/web-frontend"
- "cluster.local/ns/default/sa/waypoint"
kubectl apply -f allow-ingress-gateway.yaml
kubectl apply -f allow-ingress-frontend.yaml
kubectl apply -f allow-web-frontend-customers.yaml
Step 7: Verify Traffic Flow
minikube tunnel
curl -H "Host: customers.default.svc.cluster.local" http://127.0.0.1
Check:
- Users can access ingress gateway
- Traffic flows through waypoint proxy
- Policies enforced correctly
Step 8: Cleanup (Ambient)
kubectl delete authorizationpolicy --all -n default
kubectl delete gateway ingress-gateway -n default
kubectl delete httproute web-frontend
kubectl delete waypoint
kubectl delete deploy web-frontend customers-v1
kubectl delete service web-frontend customers
kubectl delete serviceaccount web-frontend customers-v1
kubectl delete pod curl
Key Differences: Sidecar vs Ambient
| Sidecar Mode | Ambient Mode | |
|---|---|---|
| Gateway | Istio Gateway | Gateway API |
| Routing | VirtualService | HTTPRoute |
| Ingress SA | istio-ingressgateway-service-account | ingress-gateway-istio |
| Waypoint | Not needed | Must allow waypoint SA |
| Error message | RBAC: access denied | Connection reset by peer |
Lab shows: How to use AuthorizationPolicy for access control
Pattern: Deny-all → Allow specific paths
Sidecar mode: Use service account principals
Ambient mode: Must allow waypoint proxy SA too
Traffic flow:
- Ingress Gateway → Web Frontend → Customers
- Each hop needs explicit ALLOW policy
Advanced Features
Multi-cluster Deployments
What is Multi-cluster?
Multi-cluster = Two or more Kubernetes clusters working together
Benefits:
- Higher availability
- Stronger isolation
Cost: More complex setup and operations
Use case: High availability (HA) across zones and regions
Network Deployment Models
Single Network
What: All clusters in same network
Pods: Can reach each other directly using Pod IPs
Multi-Network
What: Clusters in different networks
Problem: Pod IPs not routable across networks
Solution: Use gateways for cross-network traffic (east-west)
Configure with (Istio 1.17+):
- Traditional:
Gateway+VirtualService+DestinationRule - Modern: Kubernetes Gateway API (
Gateway+HTTPRoute)
Benefits:
- Better fault tolerance
- Handles overlapping IP ranges
- Addresses IP exhaustion
Control Plane Deployment Models
1. Single Control Plane
Setup: One Istiod in primary cluster, other clusters are remote
How it works: All clusters connect to single control plane
Pros: Centralized operations
Cons: If primary fails, affects all clusters
2. External Control Plane
Setup: Istiod runs outside your clusters (cloud-managed)
How it works: External control plane configures multiple data-plane clusters
Pros:
- Fully separated control/data planes
- Simplified upgrades
- Managed certificate handling
Use case: Cloud-managed Istio services
3. Multiple Control Planes (Recommended)
Setup: Separate Istiod in each cluster
How it works: Each cluster has its own control plane
Pros:
- Higher availability
- Regional independence
- If one fails, only that cluster affected
- Can implement failover
Best for: Large-scale environments
Control Plane Comparison
| Model | Istiod Location | Availability | Complexity |
|---|---|---|---|
| Single | One primary cluster | Lower | Simple |
| External | Outside clusters | Medium | Medium |
| Multiple | Each cluster | Highest | Higher |
Not supported for multi-cluster yet. This section focuses on Sidecar mode.
Mesh Deployment Models
Single Mesh
What: All services belong to one logical mesh
Scope: Can span multiple clusters/networks
Use case: Standard multi-cluster setup
Multi-Mesh
What: Multiple distinct meshes federated together
How it works:
- Each mesh exposes certain services to other meshes
- Requires trust relationships (shared CA)
- Cross-mesh routing via policies and gateways
Use case: Large organizations needing strict isolation between teams
Tenancy Models
What is a Tenant?
Tenant = Group of users sharing common privileges to workloads
Soft Multi-Tenancy
Implementation: Namespaces + authorization policies
Characteristics:
- Same control plane for all tenants
- Shared compute resources
- Namespaces with same name across clusters = single namespace
Traffic behavior: Istio load balances across all matching endpoints in all clusters
Strong Isolation
Implementation: Each cluster as its own mesh
Characteristics:
- Services in different meshes don't share namespaces
- Cross-mesh communication explicitly controlled
Best Multi-cluster Deployment
Recommended Topology
Run Istiod in each cluster
Benefits:
- High availability: One cluster failure doesn't affect others
- Configuration independence: Upgrade clusters separately
- Clear boundaries: Localized troubleshooting
Cross-Cluster Traffic
Recommended: Use ingress/east-west gateways
Why not direct Pod-to-Pod?
- Requires exchanging large amounts of endpoint data
- Complicates network setup
Gateway benefits:
- Reduces complexity
- More secure
- Well-defined traffic paths
Key Principles
Control plane: One Istiod per cluster (most robust)
Cross-cluster traffic: Use gateways, not direct Pod IPs
Multi-tenancy: Use namespace policies or multiple meshes
Scale: Each cluster well-defined for connectivity and control-plane boundaries
Multi-cluster = 2+ clusters for high availability
Network models:
- Single network = Direct Pod communication
- Multi-network = Use gateways
Control plane models:
- Single = One Istiod (simple, less HA)
- External = Cloud-managed (simplified ops)
- Multiple = One per cluster (best HA)
Mesh models:
- Single mesh = All services together
- Multi-mesh = Federated meshes with isolation
Best practice: Istiod per cluster + gateways for cross-cluster traffic
Ambient mode: Not supported for multi-cluster yet
VM Workloads
What is VM Workload?
VM workload = Virtual machines running your applications
Can connect to Istio mesh (Sidecar mode only)
Two Resources for VMs
1. WorkloadGroup
What: Template for VM instances (like Kubernetes Deployment)
Contains:
- Common metadata
- Port definitions
- Labels
- Service account
Use: Define once, applies to all VMs in group
2. WorkloadEntry
What: Single VM instance (like Kubernetes Pod)
Contains:
- VM IP address
- Labels
- Instance details
Creation:
- Auto-registration: Created automatically when VM joins
- Manual: Create manually or use
istioctl x workload entry configure
Network Architectures
Single-Network Architecture
Setup: Kubernetes cluster and VMs in same L3 network
Connectivity: VMs can reach Istiod and Pods directly by IP
Gateway: Optional (can route through istio-ingressgateway but not required)
Auto-registration: VM contacts Istiod on startup, creates WorkloadEntry automatically
Multi-Network Architecture
Setup: VMs in different network than Kubernetes cluster
Problem: Pods can't reach VM IPs directly
Solution: Use east-west gateway to bridge networks
Traffic flow: All traffic (control plane + data plane) goes through gateway
VM config: Must know gateway address for secure connection to Istiod
Architecture Comparison
| Single-Network | Multi-Network | |
|---|---|---|
| VM location | Same network as K8s | Different network |
| Direct connectivity | ✅ Yes | ❌ No |
| Gateway required | Optional | Required |
| Traffic path | Direct or via gateway | Through gateway |
| Use case | Simple setup | Isolated networks |
Representing VMs in Istio
WorkloadGroup Resource
Purpose: Template for VM group
Example:
apiVersion: networking.istio.io/v1
kind: WorkloadGroup
metadata:
name: customers-workload
namespace: vm-namespace
spec:
metadata:
labels:
app: customers
template:
serviceAccount: customers
ports:
http: 8080
What happens: When VM starts, WorkloadEntry created automatically (if auto-registration enabled)
WorkloadEntry Resource
Purpose: Represents single VM instance
Like: Kubernetes Pod
Contains: IP address, labels, metadata
Creation methods:
- Auto-registration (VM joins, entry created)
- Manual creation
- Using istioctl command
Kubernetes Service (Optional)
When to use: Want VMs to share same hostname as K8s service
Example: serviceName.namespace.svc.cluster.local
How: Create K8s Service with same labels as VMs
Result: Load balance between VMs and Pods together
Alternative: Use ServiceEntry + WorkloadEntry for inbound/outbound traffic
Auto-Registration
What: VM automatically registers with Istio on startup
How it works:
- VM contacts Istiod (or gateway)
- Uses WorkloadGroup template
- WorkloadEntry created automatically
- VM joins mesh
Benefits: No manual WorkloadEntry creation needed
Multi-Network Setup
Requirements:
- VM knows gateway address
- Gateway bridges networks
- Bootstrap config includes gateway address
Traffic:
- Control plane: VM → Gateway → Istiod
- Data plane: VM → Gateway → Pods
- mTLS tunnels through gateway
Key Concepts
| Concept | Kubernetes Equivalent | Purpose |
|---|---|---|
| WorkloadGroup | Deployment | Template for VMs |
| WorkloadEntry | Pod | Single VM instance |
| Service | Service | Load balancing |
| Auto-registration | - | Automatic VM joining |
VM workloads = Connect VMs to Istio mesh (Sidecar mode)
Two resources:
- WorkloadGroup = Template (like Deployment)
- WorkloadEntry = Single VM (like Pod)
Network models:
- Single-network = Direct connectivity (gateway optional)
- Multi-network = Gateway required (bridges networks)
Auto-registration = VM joins automatically, WorkloadEntry created
Service = Optional, for load balancing VMs with Pods
Multi-network = VM needs gateway address in bootstrap config
WebAssembly (Wasm)
What is WebAssembly?
WebAssembly (Wasm) = Portable binary format for executable code
Key features:
- Open standard
- Write code in any language (Go, Rust, etc.)
- Compile to WebAssembly
- Programming-language agnostic
Why Wasm for Plugins?
Ideal for plugins because:
- Binary portability
- Language agnostic
- Memory-safe sandbox (virtual machine)
- Isolated from host environment
- Well-defined API for communication
Proxy-Wasm
What: Specification for extending proxies with WebAssembly
Target: Envoy proxy (Istio's sidecar)
Purpose: Standard API for proxy extensions
Extension Options
1. Lua Filter
What: Write custom Lua script in EnvoyFilter
Example: Inject HTTP header into response
Use when: Simple functionality needed
Type: type.googleapis.com/envoy.config.filter.http.lua.v2.Lua
2. Wasm Filter
What: Write code in Go/Rust, compile to Wasm plugin
How it works:
- Write custom functionality (Go, Rust, etc.)
- Compile to Wasm plugin
- Envoy loads it dynamically at runtime
Use when: Complex functionality needed
WasmPlugin Resource (Istio 1.12+)
What: New resource to configure Wasm plugins
Benefits:
- Easier than EnvoyFilter
- Download from OCI-compliant registry
- Push like Docker images
- Istio agent handles downloading
WasmPlugin Example
apiVersion: extensions.istio.io/v1alpha1
kind: WasmPlugin
metadata:
name: hello-world-wasm
namespace: default
spec:
selector:
labels:
app: hello-world
url: oci://my-registry/tetrate/hello-world:v1
pluginConfig:
greeting: hello
something: anything
vmConfig:
- name: TRUST_DOMAIN
value: "cluster.local"
Key Fields
1. selector
Purpose: Choose which workloads get the plugin
Uses: Labels to match workloads
Example: app: hello-world
2. url
Purpose: Location of Wasm plugin
Valid schemes:
oci://(default) - OCI registryfile://- Local filehttp[s]://- HTTP URL
Optional settings:
imagePullPolicy- When to pull imageimagePullSecret- Credentials for private registry
3. pluginConfig
Purpose: Configuration for the plugin
How it works: Plugin code reads this config via Proxy-Wasm API call
Example: Pass greeting message, settings, etc.
4. vmConfig
Purpose: Configure VM running the plugin
What it does: Inject environment variables into VM
Example: Set TRUST_DOMAIN for the plugin
Other Settings
priority
Purpose: Order of WasmPlugins
Use: When multiple plugins applied
phase
Purpose: Where in filter chain to inject plugin
Use: Control execution order in Envoy
Workflow
Development:
1. Write code (Go, Rust, etc.)
↓
2. Compile to Wasm
↓
3. Push to OCI registry (like Docker Hub)
↓
4. Create WasmPlugin resource
↓
5. Istio agent downloads plugin
↓
6. Envoy loads and runs plugin
Lua vs Wasm Comparison
| Lua Filter | Wasm Filter | |
|---|---|---|
| Language | Lua only | Any (Go, Rust, etc.) |
| Complexity | Simple tasks | Complex functionality |
| Configuration | EnvoyFilter | WasmPlugin |
| Distribution | Inline script | OCI registry |
| Compilation | Not needed | Required |
| Use case | Quick scripts | Production plugins |
WebAssembly (Wasm) = Portable binary format for extending Envoy
Why use it:
- Language agnostic (Go, Rust, etc.)
- Memory-safe sandbox
- Binary portability
Two options:
- Lua filter = Simple, inline scripts
- Wasm filter = Complex, compiled plugins
WasmPlugin resource (Istio 1.12+):
- Easier than EnvoyFilter
- Download from OCI registry
- Like Docker images
Key fields:
selector= Which workloadsurl= Plugin location (oci://, file://, http://)pluginConfig= Plugin settingsvmConfig= VM environment variables
Workflow: Write code → Compile → Push to registry → Apply WasmPlugin
Lab: Connecting VM to Istio
What This Lab Does
Goal: Connect VM workload to Istio mesh running on Kubernetes
Setup: Both K8s cluster and VM on Google Cloud Platform (GCP)
Key Steps
1. Install Istio on K8s
Enable auto-registration:
istioctl install -f istio-vm-install.yaml \
--set values.pilot.env.PILOT_ENABLE_WORKLOAD_ENTRY_AUTOREGISTRATION=true \
--set values.pilot.env.PILOT_ENABLE_WORKLOAD_ENTRY_HEALTHCHECKS=true
Deploy east-west gateway (exposes control plane to VM):
samples/multicluster/gen-eastwest-gateway.sh --single-cluster | istioctl install -y -f -
Expose control plane:
kubectl apply -f samples/multicluster/expose-istiod.yaml
2. Prepare VM Files
Create namespace and service account:
export VM_NAMESPACE="vm-namespace"
export SERVICE_ACCOUNT="vm-sa"
kubectl create ns "${VM_NAMESPACE}"
kubectl create serviceaccount "${SERVICE_ACCOUNT}" -n "${VM_NAMESPACE}"
Create WorkloadGroup:
istioctl x workload group create --name "${VM_APP}" \
--namespace "${VM_NAMESPACE}" \
--labels app="${VM_APP}" \
--serviceAccount "${SERVICE_ACCOUNT}" > workloadgroup.yaml
kubectl apply -f workloadgroup.yaml
Generate VM config files:
istioctl x workload entry configure -f workloadgroup.yaml \
-o "${WORK_DIR}" --autoregister --clusterID "Kubernetes"
Files generated:
cluster.env- Metadata (namespace, service account, network)istio-token- Token for getting certsmesh.yaml- Proxy configroot-cert.pem- Root certificatehosts- Hosts file for reaching istiod
3. Configure VM
Copy files to VM:
gcloud compute scp vm-files/* my-mesh-vm:~ --zone=[ZONE]
On VM, install and configure:
# Copy root cert
sudo mkdir -p /etc/certs
sudo cp root-cert.pem /etc/certs/root-cert.pem
# Copy token
sudo mkdir -p /var/run/secrets/tokens
sudo cp istio-token /var/run/secrets/tokens/istio-token
# Install Istio sidecar
curl -LO https://storage.googleapis.com/istio-release/releases/1.24.3/deb/istio-sidecar.deb
sudo dpkg -i istio-sidecar.deb
# Copy config files
sudo cp cluster.env /var/lib/istio/envoy/cluster.env
sudo cp mesh.yaml /etc/istio/config/mesh
# Add istiod host
sudo sh -c 'cat $(eval echo ~$SUDO_USER)/hosts >> /etc/hosts'
# Fix permissions
sudo chown -R istio-proxy /var/lib/istio /etc/certs /etc/istio/proxy
# Start Istio
sudo systemctl start istio
4. Verify Connection
Watch WorkloadEntry creation:
kubectl get workloadentry -n vm-namespace --watch
Result: WorkloadEntry appears automatically when VM starts Istio
5. Access K8s Services from VM
Deploy service in K8s:
kubectl label namespace default istio-injection=enabled
kubectl apply -f hello-world.yaml
From VM, access K8s service:
curl http://hello-world.default
# Returns: Hello World
6. Access VM Service from K8s
Run service on VM:
sudo python3 -m http.server 80
Create K8s Service for VM:
apiVersion: v1
kind: Service
metadata:
name: hello-vm
namespace: vm-namespace
spec:
ports:
- port: 80
name: http-vm
selector:
app: hello-vm
From K8s pod, access VM service:
kubectl run curl --image=radial/busyboxplus:curl -i --tty --rm
curl hello-vm.vm-namespace
# Returns: Directory listing
Key Concepts
Auto-registration: VM automatically creates WorkloadEntry when joining mesh
East-west gateway: Exposes control plane to VMs
WorkloadGroup: Template for VM workloads
WorkloadEntry: Created automatically for each VM
Bidirectional: VM can access K8s services AND K8s can access VM services
Lab shows: How to connect VM to Istio mesh
Steps:
- Install Istio with auto-registration enabled
- Deploy east-west gateway
- Generate VM config files
- Install Istio sidecar on VM
- Start Istio service on VM
Result: VM joins mesh, WorkloadEntry created automatically
Bidirectional access:
- VM → K8s services (using service names)
- K8s → VM services (using K8s Service)
Lab 2: Wasm Plugins
What This Lab Does
Goal: Write simple WebAssembly plugin using Rust and load it into Envoy sidecar to add custom HTTP headers
Prerequisites
1. Rust Toolchain
Install Rust: https://www.rust-lang.org/tools/install
Requires: cargo command available
Version: Use stable or later
2. Wasm Target
Add Wasm target:
rustup target add wasm32-wasi
3. Docker/Podman
Purpose: Package .wasm file into image and push to OCI registry
Execute examples in WSL or Unix-like environment to avoid path/compilation issues
Step 1: Initialize Project
Create Directory
mkdir wasm-extension-rs && cd wasm-extension-rs
Initialize Cargo Project
cargo init --lib
Generates: Cargo.toml and src/lib.rs
Add Dependencies to Cargo.toml
[package]
name = "wasm-extension-rs"
version = "0.1.0"
edition = "2021"
[dependencies]
proxy-wasm = "0.2.2"
serde_json = "1.0"
serde = { version = "1.0", features = ["derive"] }
log = "0.4"
[lib]
crate-type = ["cdylib"]
Key setting: crate-type = ["cdylib"] = Output is dynamic library (suitable for Wasm)
Step 2: Write Plugin Logic
File: src/lib.rs
What it does:
- Parses JSON config from
WasmPlugin - Inserts key-value pairs into HTTP response headers
Key parts:
1. Define Config Struct
#[derive(Deserialize, Default, Clone)]
struct PluginConfig {
header_1: String,
header_2: String,
}
2. RootContext
Function: on_configure - Called when Wasm VM initializes
Does:
- Retrieves
pluginConfigfrom Istio's WasmPlugin - Parses JSON into
PluginConfigstruct
3. HttpContext
Function: on_http_response_headers - Called during backend response
Does:
- Injects
header_1andheader_2into response headers
Step 3: Compile Wasm Binary
cargo build --release --target wasm32-wasi
Output: target/wasm32-wasi/release/wasm_extension_rs.wasm
Rename for easier packaging:
cp target/wasm32-wasi/release/wasm_extension_rs.wasm plugin.wasm
Step 4: Package and Push to OCI Registry
Create Dockerfile
FROM scratch
COPY plugin.wasm /plugin.wasm
Build and Push
export REPO="your-dockerhub-username/wasm-plugin-rs"
docker build -t $REPO:v1 .
docker push $REPO:v1
Step 5: Create WasmPlugin Resource
File: wasm-plugin-rs.yaml
apiVersion: extensions.istio.io/v1alpha1
kind: WasmPlugin
metadata:
name: wasm-example-rs
namespace: default
spec:
selector:
matchLabels:
app: httpbin
url: oci://docker.io/your-dockerhub-username/wasm-plugin-rs:v1
imagePullPolicy: IfNotPresent
pluginConfig:
header_1: "my-first-header"
header_2: "my-second-header"
Apply:
kubectl apply -f wasm-plugin-rs.yaml
Key fields:
selector.matchLabels= Which workloads get plugin (here:app=httpbin)url= OCI registry location withoci://prefixpluginConfig= JSON config passed to plugin
Step 6: Deploy and Test
Enable Sidecar Injection
kubectl label namespace default istio-injection=enabled
Deploy httpbin
kubectl apply -f https://raw.githubusercontent.com/istio/istio/master/samples/httpbin/httpbin.yaml
Wait for Pod
kubectl get pods
Test with curl
# Deploy test pod
kubectl run curl --image=curlimages/curl:latest --image-pull-policy=IfNotPresent --command -- /bin/sh -c "sleep infinity"
# Send request
kubectl exec -it curl -- curl -s --head httpbin:8000/get
Expected Output
HTTP/1.1 200 OK
access-control-allow-credentials: true
access-control-allow-origin: *
content-type: application/json; charset=utf-8
date: Thu, 20 Mar 2025 08:57:16 GMT
x-envoy-upstream-service-time: 33
header_1: my-first-header
header_2: my-second-header
server: envoy
transfer-encoding: chunked
Success: Custom headers header_1 and header_2 appear in response!
Key Concepts
Rust vs Other Options
| Option | Pros | Cons | Use Case |
|---|---|---|---|
| Rust/C++ | High performance, memory safety, portable | Requires compilation | Production, complex logic |
| Lua | No compilation, simple | Lower performance | Lightweight scripts |
| External Processing | Any language via gRPC | Network overhead | Maximum flexibility |
Why Not proxy-wasm-go-sdk?
Reason: TinyGo has memory management limitations
Status: Community no longer recommends for production
Alternative: Use Rust or C++ instead
WasmPlugin Status
Current: Alpha stage in Istio
Usability: Sufficient for most common use cases
Future: Watch for updates in new Istio releases
Lab shows: Write Rust Wasm plugin and load into Envoy
Steps:
- Install Rust + add wasm32-wasi target
- Create Cargo project with proxy-wasm dependency
- Write plugin logic (parse config, inject headers)
- Compile to Wasm binary
- Package into OCI image and push
- Create WasmPlugin resource
- Test with httpbin
Result: Custom headers injected into HTTP responses
Use Rust for: Production plugins with complex logic
Use Lua for: Simple, lightweight scripts
External Processing: Any language via gRPC (but has network overhead)
Troubleshooting
Envoy Basics
What is Envoy?
Envoy = High-performance proxy for cloud-native applications
Role in Istio: Acts as the data plane
Core Concepts
Four key components:
1. Listeners
What: Named network locations (IP + port) where Envoy receives inbound traffic
Example: 0.0.0.0:15006 for inbound, 0.0.0.0:15001 for outbound
2. Routes
What: Define how traffic is handled once received by listener
Does: Routing rules, matching conditions
3. Clusters
What: Logical groups of upstream endpoints
Example: All pods of a service grouped together
4. Endpoints
What: Actual destination IPs and ports that receive traffic
Example: Individual pod IPs
Mapping to Istio/Kubernetes
| Envoy Concept | Maps To |
|---|---|
| Listeners | Gateway, VirtualService |
| Routes | VirtualService, DestinationRule |
| Clusters | Kubernetes Service |
| Endpoints | Pod IPs |
How Envoy Works in Istio
Configuration: Istio control plane (istiod) configures Envoy dynamically
Two modes: Sidecar Mode and Ambient Mode
Sidecar Mode
How It Works
Setup: Each workload has Envoy proxy injected as sidecar container
Traffic redirection: Uses iptables rules
Traffic Flow
Inbound Traffic (from external sources)
Redirected to: 0.0.0.0:15006
Process:
- Traffic hits port 15006
- Envoy applies policies
- Forwards to workload
Outbound Traffic (from workload to external services)
Redirected to: 0.0.0.0:15001
Process:
- Traffic hits port 15001
- Envoy determines routing
- Forwards to destination
OutboundTrafficPolicy
What happens: When Envoy can't find matching route for outbound traffic
Two options:
| Policy | Behavior | Use Case |
|---|---|---|
| ALLOW_ANY (default) | Routes through PassthroughCluster | Allow external traffic |
| REGISTRY_ONLY | Blocks traffic | Strict security |
Ambient Mode
What's Different?
No sidecar proxies = No per-pod Envoy containers
Two components: Ztunnel (L4) + Waypoint Proxies (L7)
Ztunnel (L4 Proxy)
What: Lightweight Rust-based proxy
Handles: L4 (TCP) traffic
Does:
- Intercepts traffic without modifying pod networking
- Provides mTLS encryption transparently
- Runs per node (not per pod)
Waypoint Proxies (L7 Proxy)
What: Envoy-based L7 proxies
Deployed: Per service account
Handles: HTTP, gRPC, and other L7 traffic
Does:
- Authorization policies
- Request routing
- Advanced L7 features
Key Difference
Sidecar Mode: Uses Envoy listeners on ports 15006 and 15001 for traffic interception
Ambient Mode:
- No ports 15006/15001 (no per-pod sidecars)
- Ztunnel handles L4 traffic
- Waypoint proxies process L7 requests (when needed)
Traffic Flow Comparison
| Mode | L4 Traffic | L7 Traffic | Ports Used |
|---|---|---|---|
| Sidecar | Envoy sidecar | Envoy sidecar | 15006, 15001 |
| Ambient | Ztunnel | Waypoint proxy | No 15006/15001 |
Envoy = Data plane proxy in Istio
Four concepts: Listeners, Routes, Clusters, Endpoints
Sidecar Mode:
- Envoy per pod
- Inbound: port 15006
- Outbound: port 15001
- iptables redirects traffic
Ambient Mode:
- No sidecars
- Ztunnel (Rust) = L4 traffic
- Waypoint (Envoy) = L7 traffic
- No ports 15006/15001
OutboundTrafficPolicy:
ALLOW_ANY= Allow unknown destinations (default)REGISTRY_ONLY= Block unknown destinations
Envoy Example - Hands-on
What This Shows
Goal: Walk through how Envoy determines where to send request from web-frontend to customers service
Request: web-frontend → customers.default.svc.cluster.local
Step 1: Deploy Resources
kubectl apply -f gateway.yaml
kubectl apply -f web-frontend.yaml
kubectl apply -f web-frontend-vs.yaml
kubectl apply -f customers-v1.yaml
kubectl apply -f customers-vs.yaml
kubectl apply -f customers-dr.yaml
Setup: Deploys only v1 version of Customer service, routes all traffic to it
Step 2: Inspect Listeners
List All Listeners
istioctl proxy-config listeners web-frontend-<pod-id>
Filter Specific Port
Question: Web frontend sends HTTP request to port 80, which listener handles it?
istioctl proxy-config listeners web-frontend-<pod-id> --address 0.0.0.0 --port 80 -o json
Answer: Traffic routes through listener on 0.0.0.0:80
Check RDS Configuration
Look for:
"rds": {
"configSource": {
"ads": {},
"resourceApiVersion": "V3"
},
"routeConfigName": "80"
}
Meaning: Listener fetches route configuration named "80" via RDS (Route Discovery Service)
Step 3: Inspect Routes
What routes do: Map virtual hosts (domains) to clusters
Check Route Config
istioctl proxy-config routes web-frontend-<pod-id> --name 80 -o json
What You'll Find
VirtualHost for customers.default.svc.cluster.local:
{
"virtualHosts": [
{
"name": "customers.default.svc.cluster.local:80",
"domains": [
"customers.default.svc.cluster.local",
"customers",
...
],
"routes": [
{
"match": {
"prefix": "/"
},
"route": {
"cluster": "outbound|80|v1|customers.default.svc.cluster.local"
}
}
]
}
]
}
Key info:
- Domains: Service can be reached by multiple names
- Match prefix
/: Matches all traffic (no advanced routing) - Cluster: Routes to
v1subset of customers service
Step 4: Inspect Clusters
Now we know cluster name: outbound|80|v1|customers.default.svc.cluster.local
Get Cluster Details
istioctl proxy-config clusters web-frontend-<pod-id> --fqdn customers.default.svc.cluster.local
Sample Output
SERVICE FQDN PORT SUBSET DIRECTION TYPE DESTINATION RULE
customers.default.svc.cluster.local 80 - outbound EDS customers.default
customers.default.svc.cluster.local 80 v1 outbound EDS customers.default
Key info:
- v1 subset exists: Because of DestinationRule configuration
- Type EDS: Endpoint Discovery Service (gets endpoints dynamically)
Step 5: Inspect Endpoints
Final step: Find actual endpoint IP and port
Get Endpoint Details
istioctl proxy-config endpoints web-frontend-<pod-id> --cluster "outbound|80|v1|customers.default.svc.cluster.local"
Sample Output
ENDPOINT STATUS OUTLIER CHECK CLUSTER
10.244.1.122:3000 HEALTHY OK outbound|80|v1|customers.default.svc.cluster.local
Result: Envoy forwards traffic to 10.244.1.122:3000 (v1 subset)
Traffic Flow Summary
1. Listener (0.0.0.0:80)
↓
Receives HTTP request to port 80
↓
2. Route (name: "80")
↓
Matches domain: customers.default.svc.cluster.local
Matches prefix: /
↓
3. Cluster (outbound|80|v1|customers.default.svc.cluster.local)
↓
v1 subset from DestinationRule
↓
4. Endpoint (10.244.1.122:3000)
↓
Actual pod IP and port
Visual Flow
Listener → Route → Cluster → Endpoint
| Step | Component | What It Does | Command |
|---|---|---|---|
| 1 | Listener | Receives traffic on port 80 | proxy-config listeners |
| 2 | Route | Maps domain to cluster | proxy-config routes |
| 3 | Cluster | Groups endpoints (v1 subset) | proxy-config clusters |
| 4 | Endpoint | Actual pod IP:port | proxy-config endpoints |
Key Commands
# List listeners
istioctl proxy-config listeners <pod-id>
# Filter listener by port
istioctl proxy-config listeners <pod-id> --address 0.0.0.0 --port 80 -o json
# Check routes
istioctl proxy-config routes <pod-id> --name 80 -o json
# Check clusters
istioctl proxy-config clusters <pod-id> --fqdn <service-fqdn>
# Check endpoints
istioctl proxy-config endpoints <pod-id> --cluster "<cluster-name>"
Envoy flow: Listener → Route → Cluster → Endpoint
Step-by-step:
- Listener (port 80) receives request
- Route (RDS config "80") matches domain and prefix
- Cluster (v1 subset) groups endpoints
- Endpoint (pod IP:port) receives traffic
Commands: Use istioctl proxy-config to inspect each step
This shows: How Istio translates high-level routing rules (VirtualService, DestinationRule) into actual Envoy configurations
Debugging Checklist
These troubleshooting steps apply primarily to Sidecar-based Istio deployments. Ambient mode uses different architecture and requires different debugging approaches.
Overview
Two main areas to check:
- Configuration Validation - Is your Istio config correct?
- Runtime Checks - Is Envoy handling config correctly?
Configuration Validation
1. Is Configuration Valid?
istioctl validate
What it does: Checks basic YAML and API syntax
istioctl validate -f myresource.yaml
Success output:
validation succeed
Error example:
unknown field "worloadSelector" in v1.ServiceEntry
istioctl analyze
What it does: Analyzes config for semantic issues
# Analyze live cluster
istioctl analyze --all-namespaces
Finds issues like:
- Non-existent hosts in VirtualServices
- Invalid subset references in DestinationRules
Error example:
Error [IST0101] (VirtualService customers.default) Referenced host not found: "cusomers.default.svc.cluster.local"
Error [IST0101] (VirtualService customers.default) Referenced host+subset in destinationrule not found: "cusomers.default.svc.cluster.local+v1"
2. Are Namespaces and Names Correct?
Key point: Most Istio resources are namespace-scoped
Common mistake: VirtualService in default namespace referencing Gateway in istio-system namespace
Rule: Resources must be in same namespace as target service (or properly configured for cross-namespace)
3. Are Selectors Correct?
Check:
- Pods have correct labels (e.g.,
app: customers) - Resources reference matching labels
- Resources are in correct namespace
Runtime Checks
istioctl x describe
What it does: Quick diagnostic summary for Pod or Service
Shows:
- Which Services match the Pod
- VirtualServices or DestinationRules affecting it
- Warnings (e.g., non-existent host)
Warning example:
WARNING: No destinations match pod subsets (checked 1 HTTP routes)
Route to cusomers.default.svc.cluster.local
Catches: Typo cusomers instead of customers
Did Envoy Accept Configuration?
istioctl proxy-status
What it does: Shows if Envoy proxies are in sync with control plane
istioctl proxy-status
Healthy status: SYNCED for CDS, LDS, EDS, RDS
Problem statuses:
STALE= Outdated configNOT SENT= Config not delivered
Possible causes:
- Networking issues (Envoy can't reach Istiod)
- Resource overload in Istiod
- Invalid Envoy configuration
Missing Pod: Sidecar injection failed or can't reach Istiod
Does Envoy Have Expected Configuration?
Use: istioctl proxy-config commands
Key Commands
| Command | What It Shows |
|---|---|
istioctl proxy-config cluster [pod] -n [namespace] | Envoy cluster config (DestinationRules) |
istioctl proxy-config route [pod] -n [namespace] | Envoy route config (VirtualServices) |
istioctl proxy-config listener [pod] -n [namespace] | Ports and filters Envoy listens on |
istioctl proxy-config endpoint [pod] -n [namespace] | Service endpoints Envoy sees |
istioctl proxy-config bootstrap [pod] -n [namespace] | Envoy's initial bootstrap config |
Example: VirtualService with 80%-20% traffic split should show weightedClusters in route config
Additional Debugging Commands
istioctl pc log
What it does: View or adjust Envoy logging level dynamically
istioctl pc log [pod]
istioctl admin
What it does: Advanced admin actions
# Set debug logging
istioctl admin log [pod] --level debug
# Port forward to Envoy admin
istioctl admin port-forward [pod] 15000
Access: Browse /config_dump, /stats, etc.
Check Istiod Logs
When to check: Configuration doesn't show up in Envoy
kubectl logs -f <istiod-pod> -n istio-system
Error example:
ADS:LDS: ACK ERROR ... script load error [string "function envoy_on_response(response_handle)..."]
Tip: Search logs for your resource name to find relevant errors
Inspecting Envoy Logs
View Sidecar Logs
kubectl logs <your-pod> -c istio-proxy -n <namespace>
Common Error Codes
| Code | Meaning | Possible Cause |
|---|---|---|
| NR | No Route | DestinationRule or VirtualService mismatch |
| UF | Upstream Failure | mTLS issue or no healthy upstream |
| UO | Upstream Overflow | Circuit breaker triggered |
| UH | No Healthy Upstream | All endpoints unhealthy or failing readiness |
Ephemeral Containers (K8s 1.25+)
What: Inject temporary debug container into running Pod
Use for: Run curl, tcpdump, network diagnostics
kubectl debug pod/<pod-name> -n <namespace> --image=busybox --target=istio-proxy
Benefit: Debug from same network namespace as Envoy without modifying Deployment
ControlZ - Istiod Logging
What: Dynamically adjust Istiod logging levels
istioctl dashboard controlz $(kubectl -n istio-system get pods -l app=istiod -o jsonpath='{.items[0].metadata.name}').istio-system
Then: Open Logging Scopes menu and adjust log level
Use for: Get more detailed pilot logs to isolate issues
Debugging Flow
1. Configuration Validation
↓
- istioctl validate (syntax)
- istioctl analyze (semantic issues)
- Check namespaces and selectors
↓
2. Runtime Checks
↓
- istioctl x describe (quick summary)
- istioctl proxy-status (sync status)
- istioctl proxy-config (Envoy config)
↓
3. Deep Debugging
↓
- Check Istiod logs
- Check Envoy logs (error codes)
- Use ephemeral containers
- Adjust logging with ControlZ
Two-step debugging:
- Configuration - Validate with
istioctl validateandistioctl analyze - Runtime - Check with
istioctl proxy-statusandistioctl proxy-config
Key commands:
istioctl validate= Check syntaxistioctl analyze= Find semantic issuesistioctl x describe= Quick diagnosticistioctl proxy-status= Check sync statusistioctl proxy-config= Inspect Envoy config
Common issues:
- Wrong namespace
- Typos in hostnames
- Mismatched selectors
- Config not synced to Envoy
Envoy error codes: NR (No Route), UF (Upstream Failure), UO (Overflow), UH (No Healthy)
Advanced: Use ephemeral containers and ControlZ for deep debugging
Real World Examples
Create a Cluster (GKE)
What This Is
Platform: Google Cloud Platform (GCP)
Purpose: Create Kubernetes cluster to host Online Boutique application with Istio
Steps to Create Cluster
1. Open GCP Console
URL: https://console.cloud.google.com/
2. Navigate to Kubernetes Engine
From Navigation → Select Kubernetes Engine
3. Create Cluster
Click Create Cluster
4. Switch to Standard Cluster
Type: Standard cluster (not Autopilot)
5. Configure Cluster
Cluster name: boutique-demo
Location type: Zonal
Zone: Pick zone closest to your location
6. Configure Node Pool
Click default-pool
Number of nodes: 5
7. Configure Node Machine Type
Click Nodes
Machine type: e2-medium (2 vCPU, 4 GB memory)
8. Create
Click Create button
Wait: Cluster creation takes a couple of minutes
Accessing the Cluster
Two options:
Option 1: Cloud Shell (Browser)
- Click Connect next to cluster
- Click Run in Cloud Shell button
- Cloud Shell opens and configures kubectl automatically
Option 2: Local Machine
- Install
gcloudCLI on your computer - Run same command from your computer
Cluster Configuration Summary
| Setting | Value |
|---|---|
| Name | boutique-demo |
| Type | Standard (Zonal) |
| Nodes | 5 |
| Machine | e2-medium (2 vCPU, 4 GB) |
| Platform | GCP |
GKE cluster setup for Istio demo:
- Name: boutique-demo
- 5 nodes with e2-medium (2 vCPU, 4 GB)
- Access: Cloud Shell or local gcloud CLI
- Can also use: Azure or AWS for same application
Install Istio Using Helm
What This Does
Method: Install Istio using Helm (package manager for Kubernetes)
Profile: Demo profile (for learning)
Installation Steps
1. Add Istio Helm Repository
helm repo add istio https://istio-release.storage.googleapis.com/charts
helm repo update
2. Install Istio Base Chart (CRDs)
helm install istio-base istio/base -n istio-system --set defaultRevision=default --create-namespace
What it does: Installs Custom Resource Definitions (CRDs)
Creates: istio-system namespace
3. Install Istio Profile
helm install istiod istio/istiod -n istio-system --set profile=demo
Profile: demo (includes extra monitoring for learning)
Installs: Istiod (control plane)
4. Enable Sidecar Auto-Injection
kubectl label namespace default istio-injection=enabled
Effect: All new pods in default namespace get sidecar automatically
5. Verify Installation
kubectl get pod -n istio-system
Check: istiod pod should be Running
Installation Summary
| Step | Command | What It Does |
|---|---|---|
| 1 | helm repo add istio | Add Istio Helm repository |
| 2 | helm install istio-base | Install CRDs |
| 3 | helm install istiod | Install control plane |
| 4 | kubectl label namespace | Enable auto-injection |
| 5 | kubectl get pod | Verify installation |
Helm installation = 3 steps:
- Base chart = CRDs
- Istiod = Control plane
- Label namespace = Auto-inject sidecars
Profile: Use demo for learning, default for production
Deploy Online Boutique Application
What This Is
Application: Online Boutique (Google's microservices demo app)
Purpose: Real-world example with multiple microservices to test Istio features
Deployment Steps
1. Clone Repository
git clone https://github.com/GoogleCloudPlatform/microservices-demo.git
2. Go to Folder
cd microservices-demo
3. Deploy Application
kubectl apply -f release/kubernetes-manifests.yaml
What it does: Creates all Kubernetes resources (Deployments, Services)
4. Check Pods
kubectl get pods
Expected: All pods show 2/2 READY (app + sidecar)
Example output:
NAME READY STATUS
adservice-xxx 2/2 Running
cartservice-xxx 2/2 Running
checkoutservice-xxx 2/2 Running
currencyservice-xxx 2/2 Running
emailservice-xxx 2/2 Running
frontend-xxx 2/2 Running
loadgenerator-xxx 2/2 Running
paymentservice-xxx 2/2 Running
productcatalogservice-xxx 2/2 Running
recommendationservice-xxx 2/2 Running
redis-cart-xxx 2/2 Running
shippingservice-xxx 2/2 Running
5. Deploy Istio Resources
kubectl apply -f ./istio-manifests
What it does: Creates Gateway and VirtualService for routing
6. Get Ingress IP
INGRESS_HOST="$(kubectl -n istio-system get service istio-ingressgateway \
-o jsonpath='{.status.loadBalancer.ingress[0].ip}')"
echo "$INGRESS_HOST"
Output: External IP address
7. Access Application
Open browser: http://<INGRESS_HOST>
You'll see: Online Boutique frontend
8. Delete frontend-external Service
kubectl delete svc frontend-external
Why: We use Istio ingress gateway now, don't need extra LoadBalancer
What's Included
| Component | Purpose |
|---|---|
| 12 microservices | Full e-commerce app |
| Load generator | Simulates traffic automatically |
| Istio manifests | Gateway + VirtualService |
| Sidecar injection | All pods get Envoy proxy |
Online Boutique = Real microservices app for testing Istio
Steps: Clone → Deploy app → Deploy Istio resources → Get IP → Access
Pods: Show 2/2 READY (app + sidecar)
Load generator: Automatically creates traffic for testing
Delete: frontend-external service (use Istio gateway instead)
Deploy Observability Tools
What This Does
Purpose: Install monitoring and tracing tools to see what's happening in the mesh
Tools: Prometheus, Grafana, Kiali, Zipkin
Installation Commands
Deploy All Tools
# Prometheus (metrics storage)
kubectl apply -f https://raw.githubusercontent.com/istio/istio/release-1.24/samples/addons/prometheus.yaml
# Grafana (metrics visualization)
kubectl apply -f https://raw.githubusercontent.com/istio/istio/release-1.24/samples/addons/grafana.yaml
# Kiali (service mesh dashboard)
kubectl apply -f https://raw.githubusercontent.com/istio/istio/release-1.24/samples/addons/kiali.yaml
# Zipkin (distributed tracing)
kubectl apply -f https://raw.githubusercontent.com/istio/istio/release-1.24/samples/addons/extras/zipkin.yaml
Troubleshooting
If you get error:
No matches for kind "MonitoringDashboard" in version "monitoring.kiali.io/v1alpha1"
Fix: Re-run the Kiali command again
Access Dashboards
Option 1: Google Cloud Shell
# Open Kiali
istioctl dash kiali
Then: Click Web Preview button → Select port 20001
Option 2: Local Terminal
# Kiali
istioctl dashboard kiali
# Grafana
istioctl dashboard grafana
# Prometheus
istioctl dashboard prometheus
# Zipkin
istioctl dashboard zipkin
Access: Browser opens automatically
What You'll See in Kiali
Service graph showing:
- All 12 microservices
- Traffic flow between services
- Request rates
- Health status (green/yellow/red)
Tools Summary
| Tool | Purpose | Port |
|---|---|---|
| Prometheus | Store metrics | 9090 |
| Grafana | Visualize metrics | 3000 |
| Kiali | Service mesh dashboard | 20001 |
| Zipkin | Distributed tracing | 9411 |
4 observability tools = Prometheus + Grafana + Kiali + Zipkin
Deploy: One kubectl command per tool
Access: Use istioctl dashboard <tool-name>
Kiali: Shows visual graph of all services and traffic
Load generator: Already running, so you'll see traffic immediately
Routing Traffic (Traffic Splitting)
What This Does
Purpose: Route traffic between two versions of frontend service (canary deployment)
Example: 70% to original version, 30% to new version
Steps
1. Delete Existing Frontend
kubectl delete deploy frontend
2. Deploy Original Version
Create file: frontend-original.yaml
Key parts:
- Label:
version: original - Image:
v0.10.2
kubectl apply -f frontend-original.yaml
3. Create DestinationRule (Define Versions)
Create file: frontend-dr.yaml
apiVersion: networking.istio.io/v1
kind: DestinationRule
metadata:
name: frontend
spec:
host: frontend.default.svc.cluster.local
subsets:
- name: original
labels:
version: original
- name: v1
labels:
version: 1.0.0
What it does: Defines two subsets (original and v1)
kubectl apply -f frontend-dr.yaml
4. Update VirtualService (Route to Original)
Create file: frontend-vs.yaml
apiVersion: networking.istio.io/v1
kind: VirtualService
metadata:
name: frontend-ingress
spec:
hosts:
- '*'
gateways:
- frontend-gateway
http:
- route:
- destination:
host: frontend
port:
number: 80
subset: original
What it does: Routes 100% traffic to original version
kubectl apply -f frontend-vs.yaml
5. Deploy New Version (v1)
Create file: frontend-v1.yaml
Key parts:
- Label:
version: 1.0.0 - Image:
v0.9.0(different layout)
kubectl apply -f frontend-v1.yaml
Note: Traffic still goes to original (safe deployment)
6. Split Traffic (70% Original, 30% v1)
Create file: frontend-30.yaml
apiVersion: networking.istio.io/v1
kind: VirtualService
metadata:
name: frontend-ingress
spec:
hosts:
- '*'
gateways:
- frontend-gateway
http:
- route:
- destination:
host: frontend
port:
number: 80
subset: original
weight: 70
- destination:
host: frontend
port:
number: 80
subset: v1
weight: 30
What it does: Splits traffic 70-30
kubectl apply -f frontend-30.yaml
Testing
Browser Test
Refresh page multiple times:
- 70% of time: See original layout
- 30% of time: See new layout (v1)
Kiali Visualization
Open Kiali → Click Graph
You'll see: Two frontend versions with traffic split shown
Traffic Flow Summary
1. Delete old frontend
↓
2. Deploy original version (labeled)
↓
3. Create DestinationRule (define subsets)
↓
4. Update VirtualService (route to original)
↓
5. Deploy v1 version (safe, no traffic yet)
↓
6. Update VirtualService (split traffic 70-30)
Key Resources
| Resource | Purpose | File |
|---|---|---|
| Deployment (original) | Original frontend | frontend-original.yaml |
| Deployment (v1) | New frontend | frontend-v1.yaml |
| DestinationRule | Define subsets | frontend-dr.yaml |
| VirtualService (100%) | Route all to original | frontend-vs.yaml |
| VirtualService (70-30) | Split traffic | frontend-30.yaml |
Traffic splitting = Canary deployment pattern
DestinationRule = Define versions (subsets)
VirtualService = Control traffic split (weights)
Safe deployment: Deploy v1 first, then gradually shift traffic
Weights: 70 + 30 = 100 (must add up to 100)
Use case: Test new version with small % of users before full rollout
Fault Injection (Chaos Testing)
What This Does
Purpose: Test how your app handles failures (chaos engineering)
Two types: Delay (slow service) and Abort (service fails)
Example 1: Inject Delay
What It Does
Target: Recommendation service
Effect: 5-second delay for 50% of requests
Create VirtualService
Create file: recommendation-delay.yaml
apiVersion: networking.istio.io/v1
kind: VirtualService
metadata:
name: recommendationservice
spec:
hosts:
- recommendationservice
http:
- route:
- destination:
host: recommendationservice
fault:
delay:
percentage:
value: 50
fixedDelay: 5s
Key parts:
percentage: 50= Affect 50% of requestsfixedDelay: 5s= Add 5-second delay
kubectl apply -f recommendation-delay.yaml
Testing Delay
Browser test:
- Open
http://<INGRESS_HOST> - Click on any product
- Scroll to "Other Products You Might Like" section
- Refresh multiple times
Result: Sometimes page loads fast, sometimes slow (5-second delay)
View in Grafana
istioctl dash grafana
Steps:
- Open Istio Service Dashboard
- Select
recommendationservicefrom service list - Select
sourcein Reporter dropdown - Look at Client Request Duration graph
You'll see: Spike showing 5-second delay
Example 2: Inject Abort (HTTP 500)
What It Does
Target: Product catalog service
Effect: HTTP 500 error for 50% of requests
Create VirtualService
Create file: productcatalogservice-abort.yaml
apiVersion: networking.istio.io/v1
kind: VirtualService
metadata:
name: productcatalogservice
spec:
hosts:
- productcatalogservice
http:
- route:
- destination:
host: productcatalogservice
fault:
abort:
percentage:
value: 50
httpStatus: 500
Key parts:
percentage: 50= Affect 50% of requestshttpStatus: 500= Return HTTP 500 error
kubectl apply -f productcatalogservice-abort.yaml
Testing Abort
Browser test:
- Refresh product page multiple times
- 50% of time: Page loads normally
- 50% of time: Error message appears
Error message: Shows "fault filter abort" as cause
View in Grafana
istioctl dash grafana
You'll see: Graphs showing HTTP 500 errors
Cleanup
kubectl delete virtualservice productcatalogservice
Fault Injection Types
| Type | What It Does | Use Case |
|---|---|---|
| Delay | Adds latency | Test timeout handling |
| Abort | Returns error code | Test error handling |
Configuration Options
| Field | Purpose | Example |
|---|---|---|
percentage.value | % of requests affected | 50 (means 50%) |
fixedDelay | Delay duration | 5s |
httpStatus | Error code to return | 500 |
Testing Flow
1. Create VirtualService with fault injection
↓
2. Test in browser (refresh multiple times)
↓
3. View metrics in Grafana
↓
4. Verify app handles failures correctly
↓
5. Delete VirtualService (cleanup)
Fault injection = Test how app handles failures
Two types:
- Delay = Make service slow (test timeouts)
- Abort = Make service fail (test error handling)
Percentage = Control how many requests affected (50 = 50%)
Use for: Chaos engineering, testing resilience
View results: Grafana shows delays and errors
Safe testing: Only affects % of requests, not all
Resiliency (Timeouts & Retries)
What This Does
Purpose: Make services resilient to failures using timeouts and retries
Features: Timeout (stop waiting) and Retry (try again)
Setup: Add Latency to Service
Edit Deployment
kubectl edit deploy productcatalogservice
Add Environment Variable
spec:
containers:
- env:
- name: EXTRA_LATENCY
value: 6s
What it does: Adds 6-second delay to every request
Save and exit
Test
Refresh page → Takes 6 seconds to load
Example 1: Add Timeout
What It Does
Target: Product catalog service
Effect: Stop waiting after 2 seconds
Create VirtualService
Create file: productcatalogservice-timeout.yaml
apiVersion: networking.istio.io/v1
kind: VirtualService
metadata:
name: productcatalogservice
spec:
hosts:
- productcatalogservice
http:
- route:
- destination:
host: productcatalogservice
timeout: 2s
Key part: timeout: 2s = Wait max 2 seconds
kubectl apply -f productcatalogservice-timeout.yaml
Testing Timeout
Refresh page → Error appears:
rpc error: code = Unavailable desc = upstream request timeout
could not retrieve products
Why: Service takes 6 seconds, but timeout is 2 seconds
Example 2: Add Retry Policy
What It Does
Target: Product catalog service
Effect: Retry 3 times, wait 1 second per try
Create VirtualService
Create file: productcatalogservice-retry.yaml
apiVersion: networking.istio.io/v1
kind: VirtualService
metadata:
name: productcatalogservice
spec:
hosts:
- productcatalogservice
http:
- route:
- destination:
host: productcatalogservice
retries:
attempts: 3
perTryTimeout: 1s
Key parts:
attempts: 3= Try 3 timesperTryTimeout: 1s= Wait 1 second per try
kubectl apply -f productcatalogservice-retry.yaml
Testing Retry
Still see errors (because service takes 6 seconds, each try times out at 1 second)
View Retries in Zipkin
istioctl dash zipkin
Steps:
- Click + button
- Select
serviceName→frontend.default - Select
minDuration→ Enter1s - Click Search
- Click Filter → Select
productCatalogService.default
You'll see: Traces showing 1-second attempts (matching perTryTimeout)
Cleanup
kubectl delete vs productcatalogservice
Resiliency Features
| Feature | What It Does | Use Case |
|---|---|---|
| Timeout | Stop waiting after X seconds | Prevent hanging requests |
| Retry | Try again if fails | Handle temporary failures |
Configuration Options
| Field | Purpose | Example |
|---|---|---|
timeout | Max wait time | 2s |
retries.attempts | How many times to retry | 3 |
retries.perTryTimeout | Max wait per try | 1s |
Testing Flow
1. Add latency to service (EXTRA_LATENCY env var)
↓
2. Test without timeout (page takes 6 seconds)
↓
3. Add timeout (2s) → See timeout error
↓
4. Add retry policy (3 attempts, 1s each)
↓
5. View retries in Zipkin traces
↓
6. Cleanup (delete VirtualService)
How It Works
Without retry:
Request → Wait 6s → Timeout at 2s → Error
With retry (3 attempts, 1s timeout each):
Attempt 1 → Wait 1s → Timeout → Retry
Attempt 2 → Wait 1s → Timeout → Retry
Attempt 3 → Wait 1s → Timeout → Final Error
Resiliency = Handle failures gracefully
Timeout = Stop waiting after X seconds (prevent hanging)
Retry = Try again if fails (handle temporary issues)
Configuration: Set in VirtualService (no code changes)
View retries: Zipkin shows each attempt
Real world: Use timeout to fail fast, retry for temporary network issues
Best practice: Set perTryTimeout < total timeout